Min / Max / Average Daily
Summarizes daily minimum, maximum and average readings for each parameter — temperature, humidity and the rest. Daily averages make trend comparison and quick performance evaluation easy.
Automatic reportThe MaxLinc web app turns a shelf of loggers into a documented operation: live dashboards, four-level alarms to unlimited recipients, twelve professional PDF and Excel reports that run on a schedule, role-based sharing, a complete interaction log, and a digital twin of every asset you maintain.
Included free with every MaxLinc logger — no subscription required to get started.
Watch how the MaxLinc web app surfaces live readings, historical trends and instant alarms across every connected logger — on any screen.
The MaxLinc web app is a progressive web app for automated monitoring, multi-channel alarms, compliance analytics and asset maintenance. Sensor data streams from the edge over no-gateway WiFi or global cellular into a Canadian cloud, where alarms, audit-grade reports, role-based sharing and a digital twin of your equipment turn raw readings into action, documentation and maintenance history.
12+
Professional report types
Unlimited
Alarm recipients per device
4
Sharing access levels
Canada
Cloud residency + daily backups
Ten capabilities, one login. Jump straight to the one you came for.
Generate customizable HACCP, FDA, VPD and MKT compliance reports on demand or on a schedule, backed by tamper-proof digital audit logs that record every alert and action. NIST-traceable calibration certificates stay linked to each sensor serial number, and all data resides in Canada with daily backups and redundancy — the documentation auditors expect, ready when they ask.
Pick a device, pick a date range, pick a report. Every report renders in the browser and downloads as a formatted PDF or a fully populated Excel workbook with the charts already drawn. Most can also run on a schedule and land in an inbox with nobody logging in.
Summarizes daily minimum, maximum and average readings for each parameter — temperature, humidity and the rest. Daily averages make trend comparison and quick performance evaluation easy.
Automatic reportTracks vaccine storage between pharmacy opening and closing times. Records opening and closing temperatures plus min/max since the last record, with optional Mean Kinetic Temperature (MKT) and vaccine out-of-range time.
ScheduledMonitors food storage between operating hours. The basic report captures temperature at opening and closing; optional sections add RH, MKT, min/max, average and Food Safe Out-of-Range Time for HACCP and compliance audits.
ScheduledReduced-resolution data for people who do not need every reading. Generates records at your chosen interval — every three hours, say — from the closest actual reading, with calculated metrics like Feels Like, EMC and Dew Point where the device supports them.
Automatic reportRecords temperature and humidity from departure to delivery. Shows min, max and average for both parameters and calculates Food Safe Out-of-Range Time across the journey to verify cold-chain integrity.
On demandEvery recorded reading in full resolution for the selected period. Depending on the logger, it adds computed metrics such as Absolute Humidity, EMC or Heat Index.
Automatic reportComputes minimum and maximum VPD for day and night periods — built for greenhouse and agricultural monitoring, to keep transpiration and plant balance in the right window.
Automatic reportHighlights the critical numbers: minimum, maximum and average within the selected interval. Useful for finding temperature extremes, environmental events or a fast diagnostic check.
Automatic reportAnalyzes light and ultraviolet exposure over the selected period. Uses the chosen light-source profile to calculate relative UV levels, total absolute UV exposure and accumulated light dosage — so you can assess degradation risk for light-sensitive material and show daily limits were not exceeded.
Automatic reportA report at any fixed reading interval from 1 to 60 minutes, covering exactly the device channels you select, exported to Excel and PDF.
On demandCombines several sensors into one synchronized report. Builds aligned datasets using closest-record matching or linear interpolation, so devices with different sampling intervals can be analysed side by side.
ScheduledAn AI-written summary of sensor performance, anomalies and recommendations based on the last 30 days of data — executive summary, insights and recommended actions.
AI generatedThe report list adapts to the logger you own. Beyond the twelve above it also offers CO2 long-exposure and alarm reports, concrete maturity curves for construction, drying and restoration reports, consumption and billing summaries for meters, and health and connectivity reports across the whole fleet.
The PDF is what an auditor gets — device identity, reporting period, alarm summary, chart and tabulated data on a clean page. The Excel workbook is what your team actually uses: every reading, every computed column, and the chart already drawn.
MaxLinc
Vaccine Fridge — Pharmacy 04
Serial 24-EDGE-08871 · 1–7 September 2026 · America/Toronto
Temperature (°C) — daily min, max and average against the 2–8 °C alarm band
| Day | Min | Max | Avg | MKT | Out of range |
|---|---|---|---|---|---|
| Mon 01 | 2.9 | 6.8 | 4.6 | 4.8 | — |
| Tue 02 | 3.1 | 7.0 | 4.9 | 5.0 | — |
| Wed 03 | 2.6 | 7.4 | 4.7 | 4.9 | — |
| Thu 04 | 3.0 | 9.1 | 5.4 | 5.6 | 14 min |
| Fri 05 | 2.8 | 6.9 | 4.5 | 4.7 | — |
| Sat 06 | 2.5 | 6.6 | 4.3 | 4.5 | — |
| Sun 07 | 2.7 | 7.1 | 4.6 | 4.8 | — |
1 excursion in the period · 14 min above 8.0 °C on Thursday 04 · acknowledged by A. Singh
| A | B | C | D | E | F | |
|---|---|---|---|---|---|---|
| 1 | Day | Min | Max | Avg | MKT | Out of range |
| 2 | Mon 01 | 2.9 | 6.8 | 4.6 | 4.8 | — |
| 3 | Tue 02 | 3.1 | 7.0 | 4.9 | 5.0 | — |
| 4 | Wed 03 | 2.6 | 7.4 | 4.7 | 4.9 | — |
| 5 | Thu 04 | 3.0 | 9.1 | 5.4 | 5.6 | 14 min |
| 6 | Fri 05 | 2.8 | 6.9 | 4.5 | 4.7 | — |
| 7 | Sat 06 | 2.5 | 6.6 | 4.3 | 4.5 | — |
| 8 | Sun 07 | 2.7 | 7.1 | 4.6 | 4.8 | — |
Trend charts with the min and max threshold bands are rendered into the PDF and embedded in the Excel workbook.
Device title, serial number, reporting period, time zone and measurement units are printed in the header block.
Out-of-range events are summarized with duration and, where the report supports it, Food Safe or vaccine out-of-range time and MKT.
Excel always carries every row. When a dataset is too large to print, the PDF shows the first rows and states the full row count so nobody mistakes a page limit for missing data.
Metric or imperial, and the report is written in the language and time zone of the person receiving it.
Every report renders in the browser first, so you can check the period and the numbers before you send anything to anyone.
Schedule a supported report to generate on a recurring basis and be emailed to the people who need it. Reports are built on the server, so a multi-thousand-row export never ties up your browser — and it keeps arriving whether or not anyone remembers to run it.
Pick the report type and the reporting window — a day, a shift, a week, a month.
How often it runs and at what hour, in the recipient’s own time zone.
PDF, Excel or both — to you and to everyone the device is shared with.
It generates in the background and emails on time. If a report cannot be generated you are told, so silence is never mistaken for compliance.
Every scheduled report can be reviewed, edited, paused or cancelled from the device it belongs to.
Generation is queued on the server; you can close the tab, and heavy exports do not block the interface.
The PDF and the Excel workbook arrive attached, with download links as a fallback.
If a scheduled report cannot run, an email says so and offers to cancel the schedule or restore access.
Automatic and scheduled reports run on devices with Premium access, which is included free for the first year with every device. On-demand reports and detailed readouts for the last 45 days are always free.
Sensors rarely sample in lockstep — one logs every 5 minutes, another every 15, a third woke up 40 seconds later. Multi-Sensor Data Consolidation aligns them into a single time-indexed dataset so they can be compared, subtracted and audited together.
Aligned time slots
For each time slot, take the reading nearest that timestamp on each device. Every value stays a real, measured number — nothing is invented.
Estimate each device’s value exactly on the time slot from the readings either side. Produces perfectly aligned curves for differencing and correlation.
Consolidated reports export to Excel and PDF and can be scheduled like any other report. When the aligned dataset is too large for the PDF, the PDF shows the first rows and points you to the Excel file for the complete set.
The moment a parameter crosses a threshold, the web app fires automated phone calls, SMS text messages, emails and push notifications and keeps going until someone responds. Alerts reach your team wherever they are, in their own time zone, across 170+ countries via the device’s built-in global cellular (eSIM) — so a freezer failure or pressure excursion is never missed.
You can add an unlimited number of alarm recipients to each device, independently. Each person sets how they want to be reached in their own profile — so the on-call technician gets a phone call at 3 a.m., the QA manager gets an email, and the store lead gets a text.
Threshold crossed, delay elapsed
Evaluates the rule, logs it, fans it out
A voice call for the alarms nobody can be allowed to sleep through.
The fastest channel that needs no app, no data plan and no login.
Full context — device, parameter, value, threshold and time — and a link into the reading.
Straight to the phone or desktop from the installed web app.
Recipients are attached to individual devices, so a 40-store chain does not send 40 stores of alarms to everyone.
Notification preferences live in each person’s own profile, alongside their language and time zone.
Anyone who needs the dashboard but not the 3 a.m. call gets Silent Viewer access — full visibility, zero alarms.
A device that misses its scheduled upload raises its own alarm, so a dead logger never looks like a healthy fridge.
Four independent alarm modes catch every kind of excursion — from instant spikes to slow, invisible drift.
Immediate alarm if a parameter goes above max or drops below min threshold.
Filters out brief fluctuations — alarms only if the condition persists.
Monitors long-term exposure compliance.
Detects gradual drifts from historical baseline data.
A monitoring system that cries wolf gets muted, and a muted system protects nothing. Every threshold, delay and filter is adjustable per device and per parameter, from the same screen you watch the readings on.
Temperature
Alarm outside 2.0 °C to 8.0 °C
Queued — applies on the device at its next upload
Independent high and low limits for temperature, humidity, CO2, current, pressure and every other channel on the device.
How long a reading may stay out of range before anyone is contacted — enough to let a door close or a defrost cycle finish.
Notify immediately, or wait an hour and only raise the alarm if the parameter is still out of range.
Watch cumulative exposure instead of instantaneous spikes, for limits that are written as an average over time.
Compare rolling 30-minute time-weighted averages back through a window you choose and alarm on a percentage of change — this catches slow failures that never break a threshold.
Raise an alarm when a device misses its scheduled upload, separately from the measurement alarms.
Make the logger itself beep on site. It costs battery, so it stays yours to switch on.
Silence a unit that is in transit or on a bench without touching anyone else’s setup.
Changes you make in the web app sync down to the hardware on its next upload, and the device card stays blue until the new settings are confirmed on the device itself — so you always know what the logger is actually running.
Share any device with as many people as you need. Everyone gets their own login, their own language and time zone and their own notification preferences — and exactly the level of control you grant them.
Sees everything, changes nothing
Full read access to live readings, history, charts, maps and reports — and they receive alarms. The default for anyone who needs the numbers but must not touch the configuration.
Full operational control
Everything a Viewer can do, plus renaming the device, adjusting alarm thresholds and delays, setting record and sync intervals, adding notes and exporting the activity log.
Watching, without the pager
Identical visibility to a Viewer with alarms switched off for that person. Built for executives, auditors and analysts who need the data but must not be woken by it.
The technician who fixes it
Configuration rights like an Editor, plus the service side: logging repairs, parts and costs against the asset. One designated service partner per device, and the account has to be registered as a service partner.
| Capability | Viewer | Editor | Silent Viewer | Service & Maintenance |
|---|---|---|---|---|
| View live readings, history, charts and maps | Yes | Yes | Yes | Yes |
| Generate and download reports | Yes | Yes | Yes | Yes |
| Receive alarm calls, texts, emails and push | Yes | Yes | No | Yes |
| Adjust alarm thresholds, delays and intervals | No | Yes | No | Yes |
| Rename the device, add notes, export the activity log | No | Yes | No | Yes |
| Log service and repair records against the asset | No | Yes | No | Yes |
| Recognized as the device’s service partner | No | No | No | Yes |
| How many per device | Unlimited | Unlimited | Unlimited | One |
Share by email address and the permission attaches itself the moment that person registers.
Locations, zones and assets share exactly like devices. Share a zone and everything inside it comes with it.
Grant someone Viewer on a zone and Editor on one sensor inside it, and they get Editor on that sensor and Viewer on the rest.
Granting, changing and revoking access are all written into the device activity log.
Compliance is not only about what the sensor measured. It is about who knew, who changed what, and when. The web app keeps two logs, and neither of them can be edited or deleted from the interface — by anyone, including the account owner.
Shows all system actions related to this device, including alarms, uploads and configuration changes.
Shows account-level actions such as login events, changes and updates.
| Time | Actor | Action |
|---|---|---|
| 08:14 | System | Reading uploaded over Wi-Fi — 4.6 °C, 41% RH |
| 08:41 | System | Alarm raised — 9.1 °C above the 8.0 °C maximum |
| 08:41 | System | Phone call to J. Tremblay · SMS to A. Singh · email to 4 recipients |
| 08:43 | A. Singh (Viewer) | Alarm acknowledged — note: door left open, now closed |
| 09:02 | M. Chen (Editor) | Maximum threshold changed 8.0 °C to 8.5 °C |
| 09:17 | System | New settings confirmed on the device |
| 11:30 | R. Okafor (Service) | Service record added — door gasket replaced, 45 min downtime |
| 17:00 | System | Scheduled Food Safety report generated and emailed (PDF + Excel) |
Owners and Editors can export the device activity log for exactly the period an auditor asks about.
Entries are written by the system. There is no edit and no delete in the interface.
Every action carries the account that performed it, which is why shared logins are the wrong answer.
Who saw the alarm, when they acknowledged it, and the note they left.
A sensor gives you a number. The digital twin tells you what that number is attached to: which pump, in which zone, in which building, installed when, serviced by whom, and how healthy it is right now.
Car Factory North · Paint Shop
Attention needed
Health score
Active insights
Sensor data shows a 15% increase in vibration over the last 48 hours. Consider scheduling an inspection to prevent bearing failure.
Live sensor data
OnlineVibration
2.4 mm/s
Approaching threshold
Temperature
68 °C
Normal
Current
14.2 A
Normal
Location
Name, address, time zone and primary contact, a pin on the map, and a dated photo gallery that accepts ordinary and 360° images.
Zone
Indoor, outdoor, refrigerated or hazardous, with a floor level, its own photo gallery, interactive 2D and 360° views with sensors and assets tagged onto the image, and MaxLinc Vista 3D spaces.
Asset
Type, manufacturer, model, serial number, year of manufacture and energy source, an optional sub-meter, and the sensors paired to it.
A health score with active insights, and live values from every paired sensor.
Manufacturer, model, serial, year, energy source and the paired sensors.
The complete repair and maintenance history for this asset.
Next inspection, maintenance interval, overhaul date and end of life.
Spare parts used, unit cost, labour and parts totals, downtime and warranty.
A dated, named, searchable gallery for this asset.
Everything scheduled for the asset, past and future.
User manual, datasheet, purchase invoice and anything else, attached.
Health is calculated from the sensors that actually predict failure for that class of asset, each weighted by how much it matters. An electric motor is scored on vibration, current and surface temperature; a chiller is not scored the same way. Every calculation is kept in the asset calculation log, so the number is never a black box.
Electric motor — how the score is weighted
Locations, zones and assets share with the same four access levels as devices. Share a zone and every asset, sensor, photo and 3D space inside it comes with it at that level.
Every service visit is logged against the equipment it happened to, by the technician who did it, with what it cost and how long the line was down. Two years later the history is still there, still searchable, still attached to the asset.
Give your maintenance contractor Service & Maintenance access and they log the visit themselves. You get the record without chasing an invoice for it.
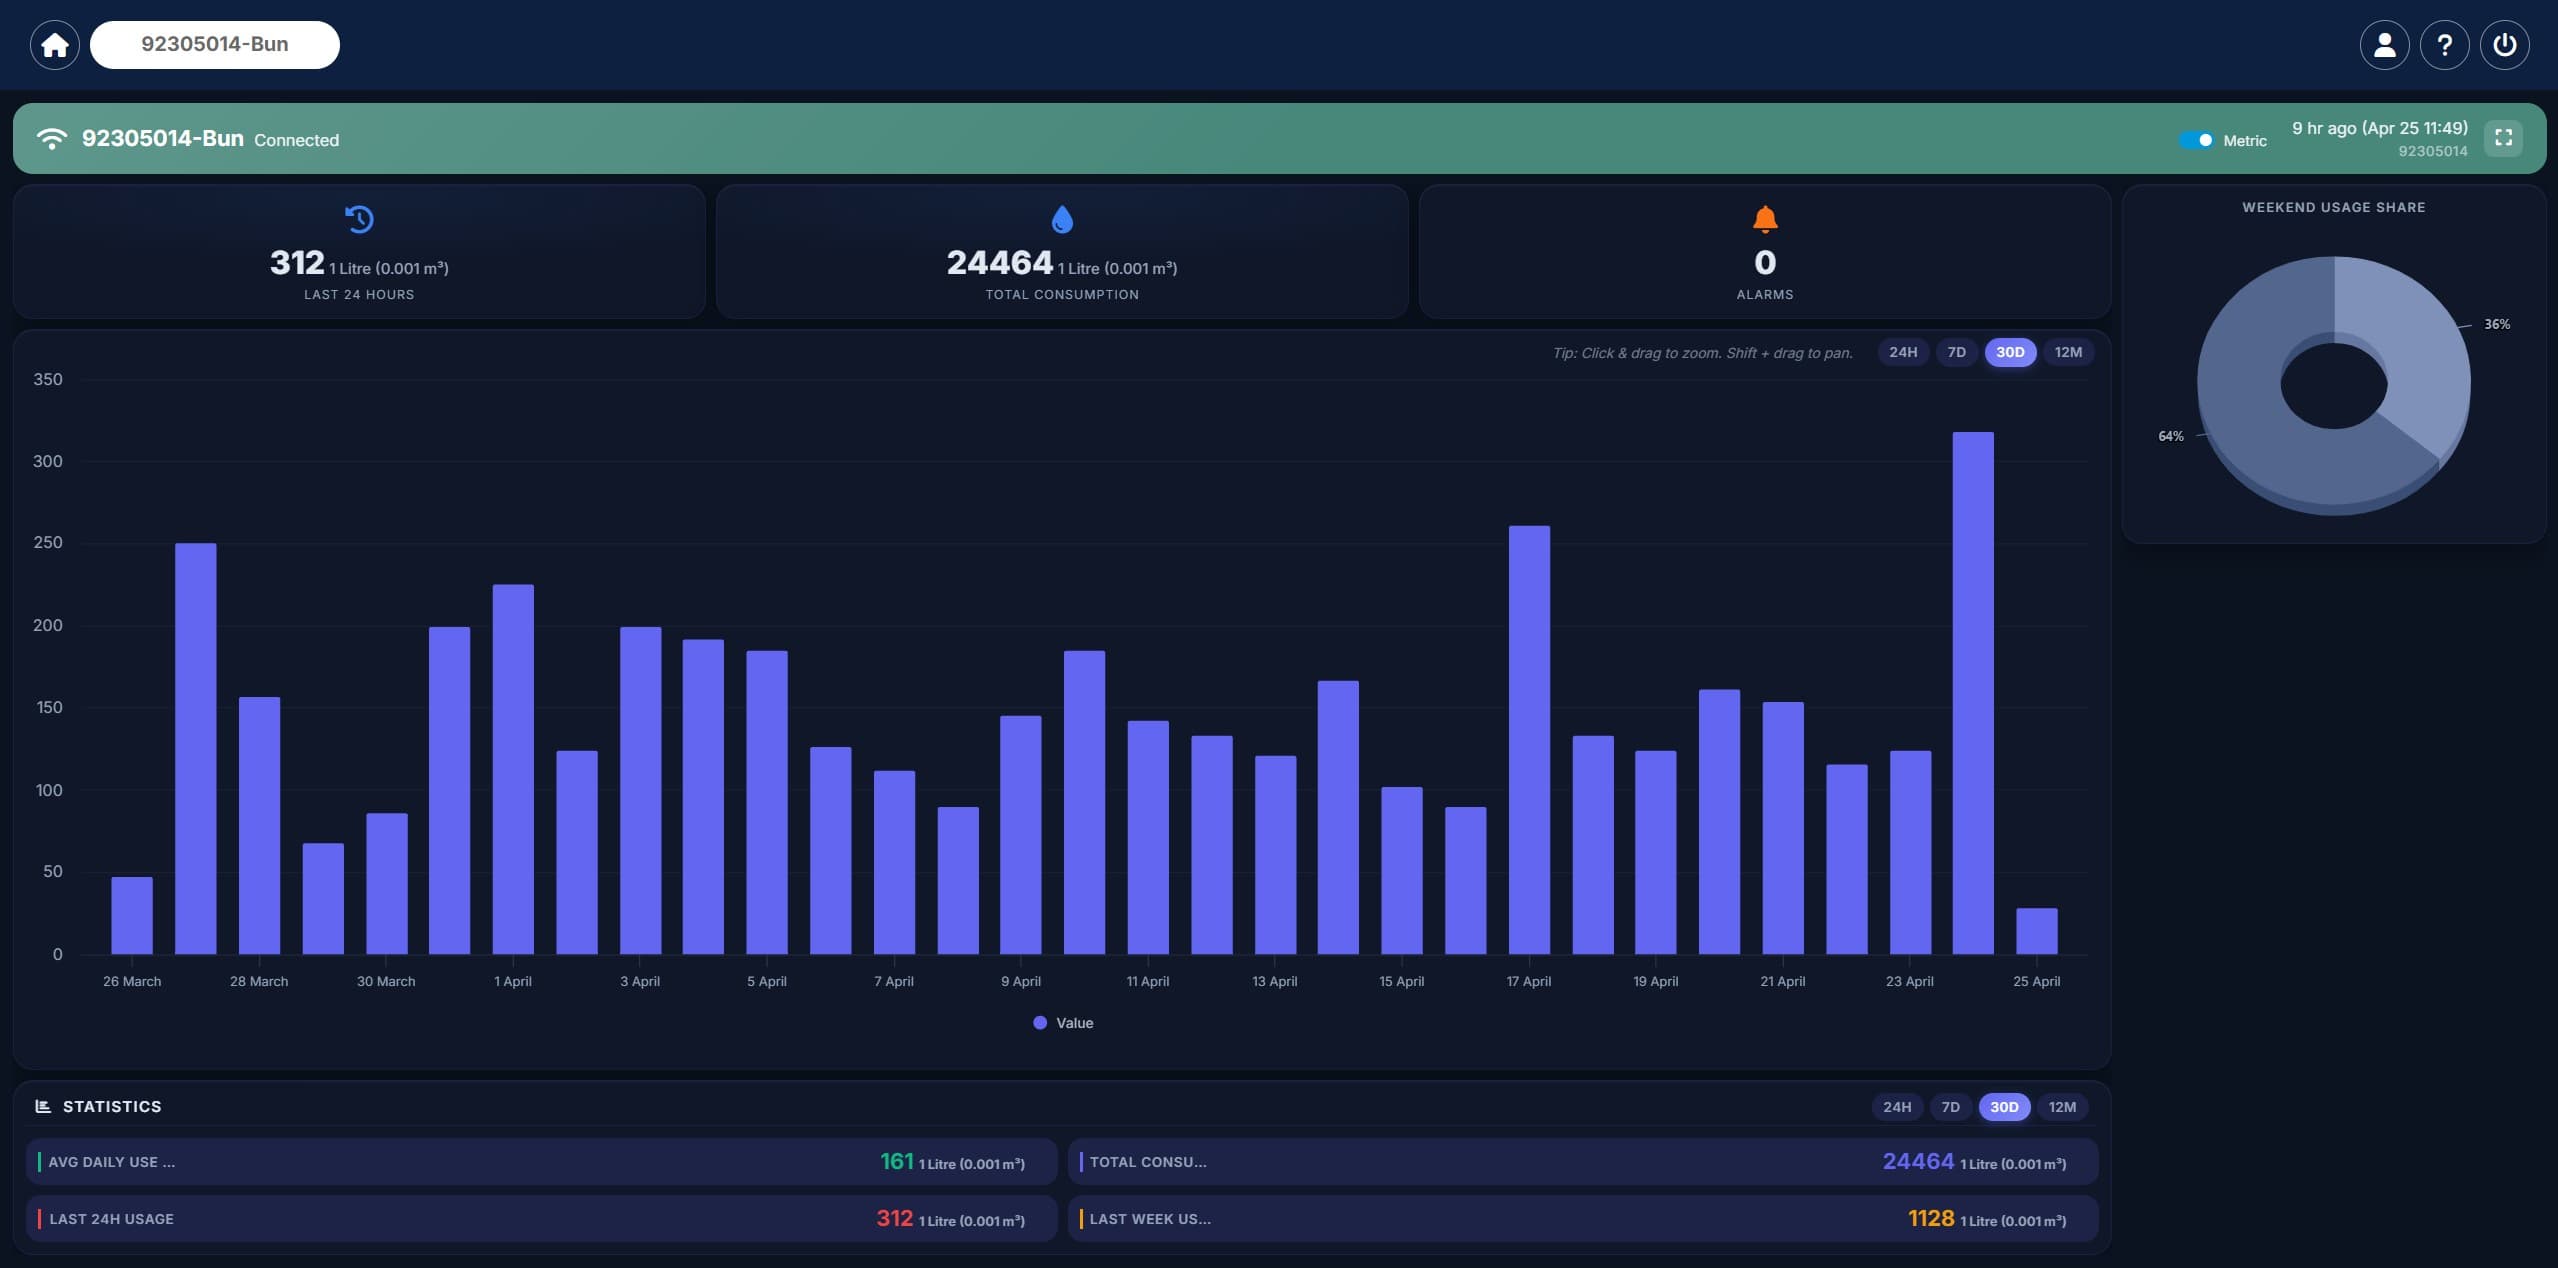
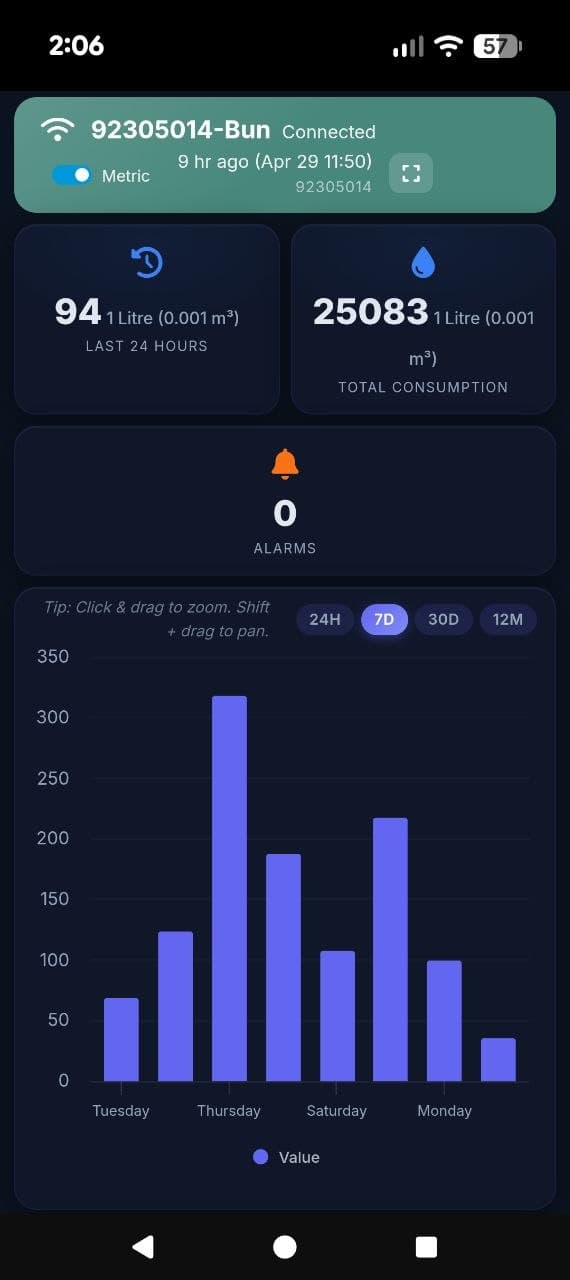
The MaxLinc web app runs on any phone, tablet or desktop with no install required. Interactive geo-location maps show all your sensors on one screen, dynamic graphs reveal historical trends, and the interface is available in 24 languages so every team member reads the data and alarms in their own language and time zone.
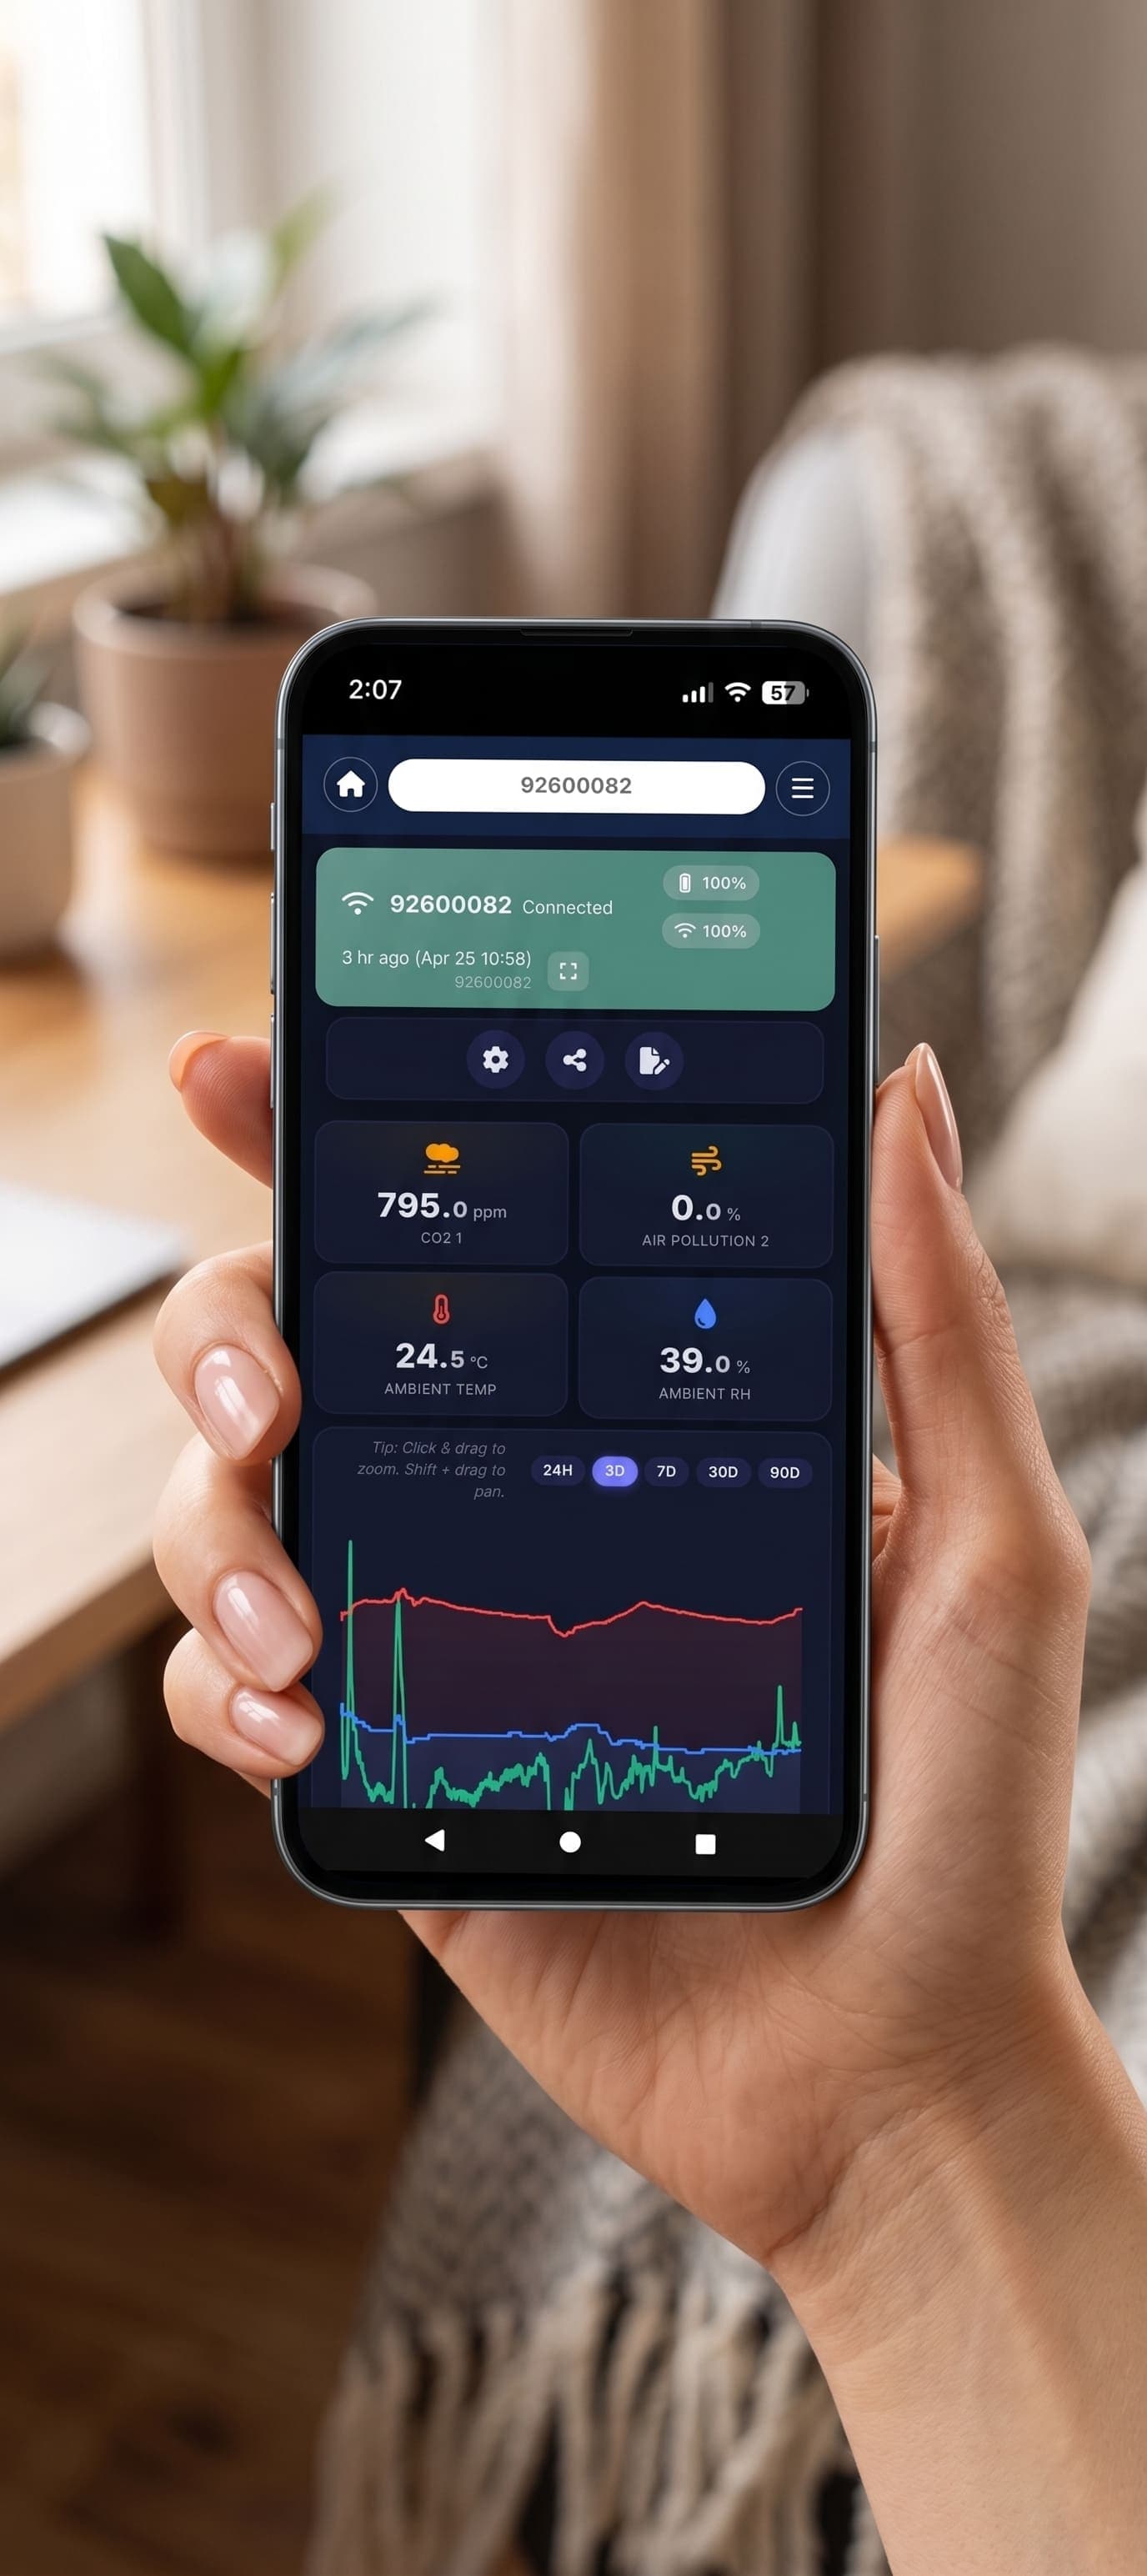
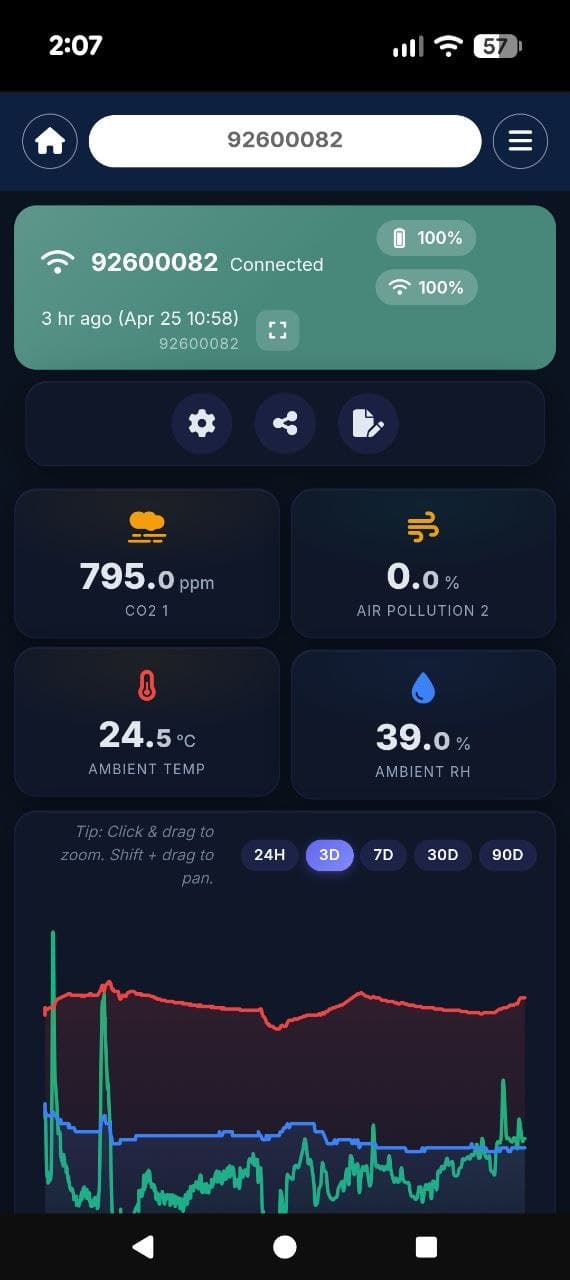
The same real-time dashboard on desktop, tablet and phone — no install, just a browser.


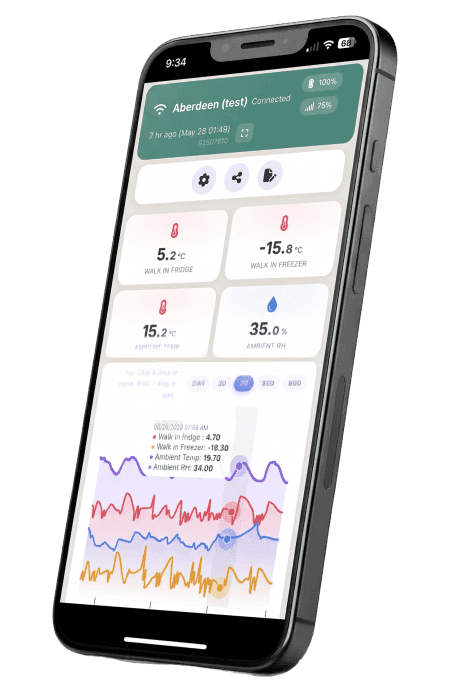
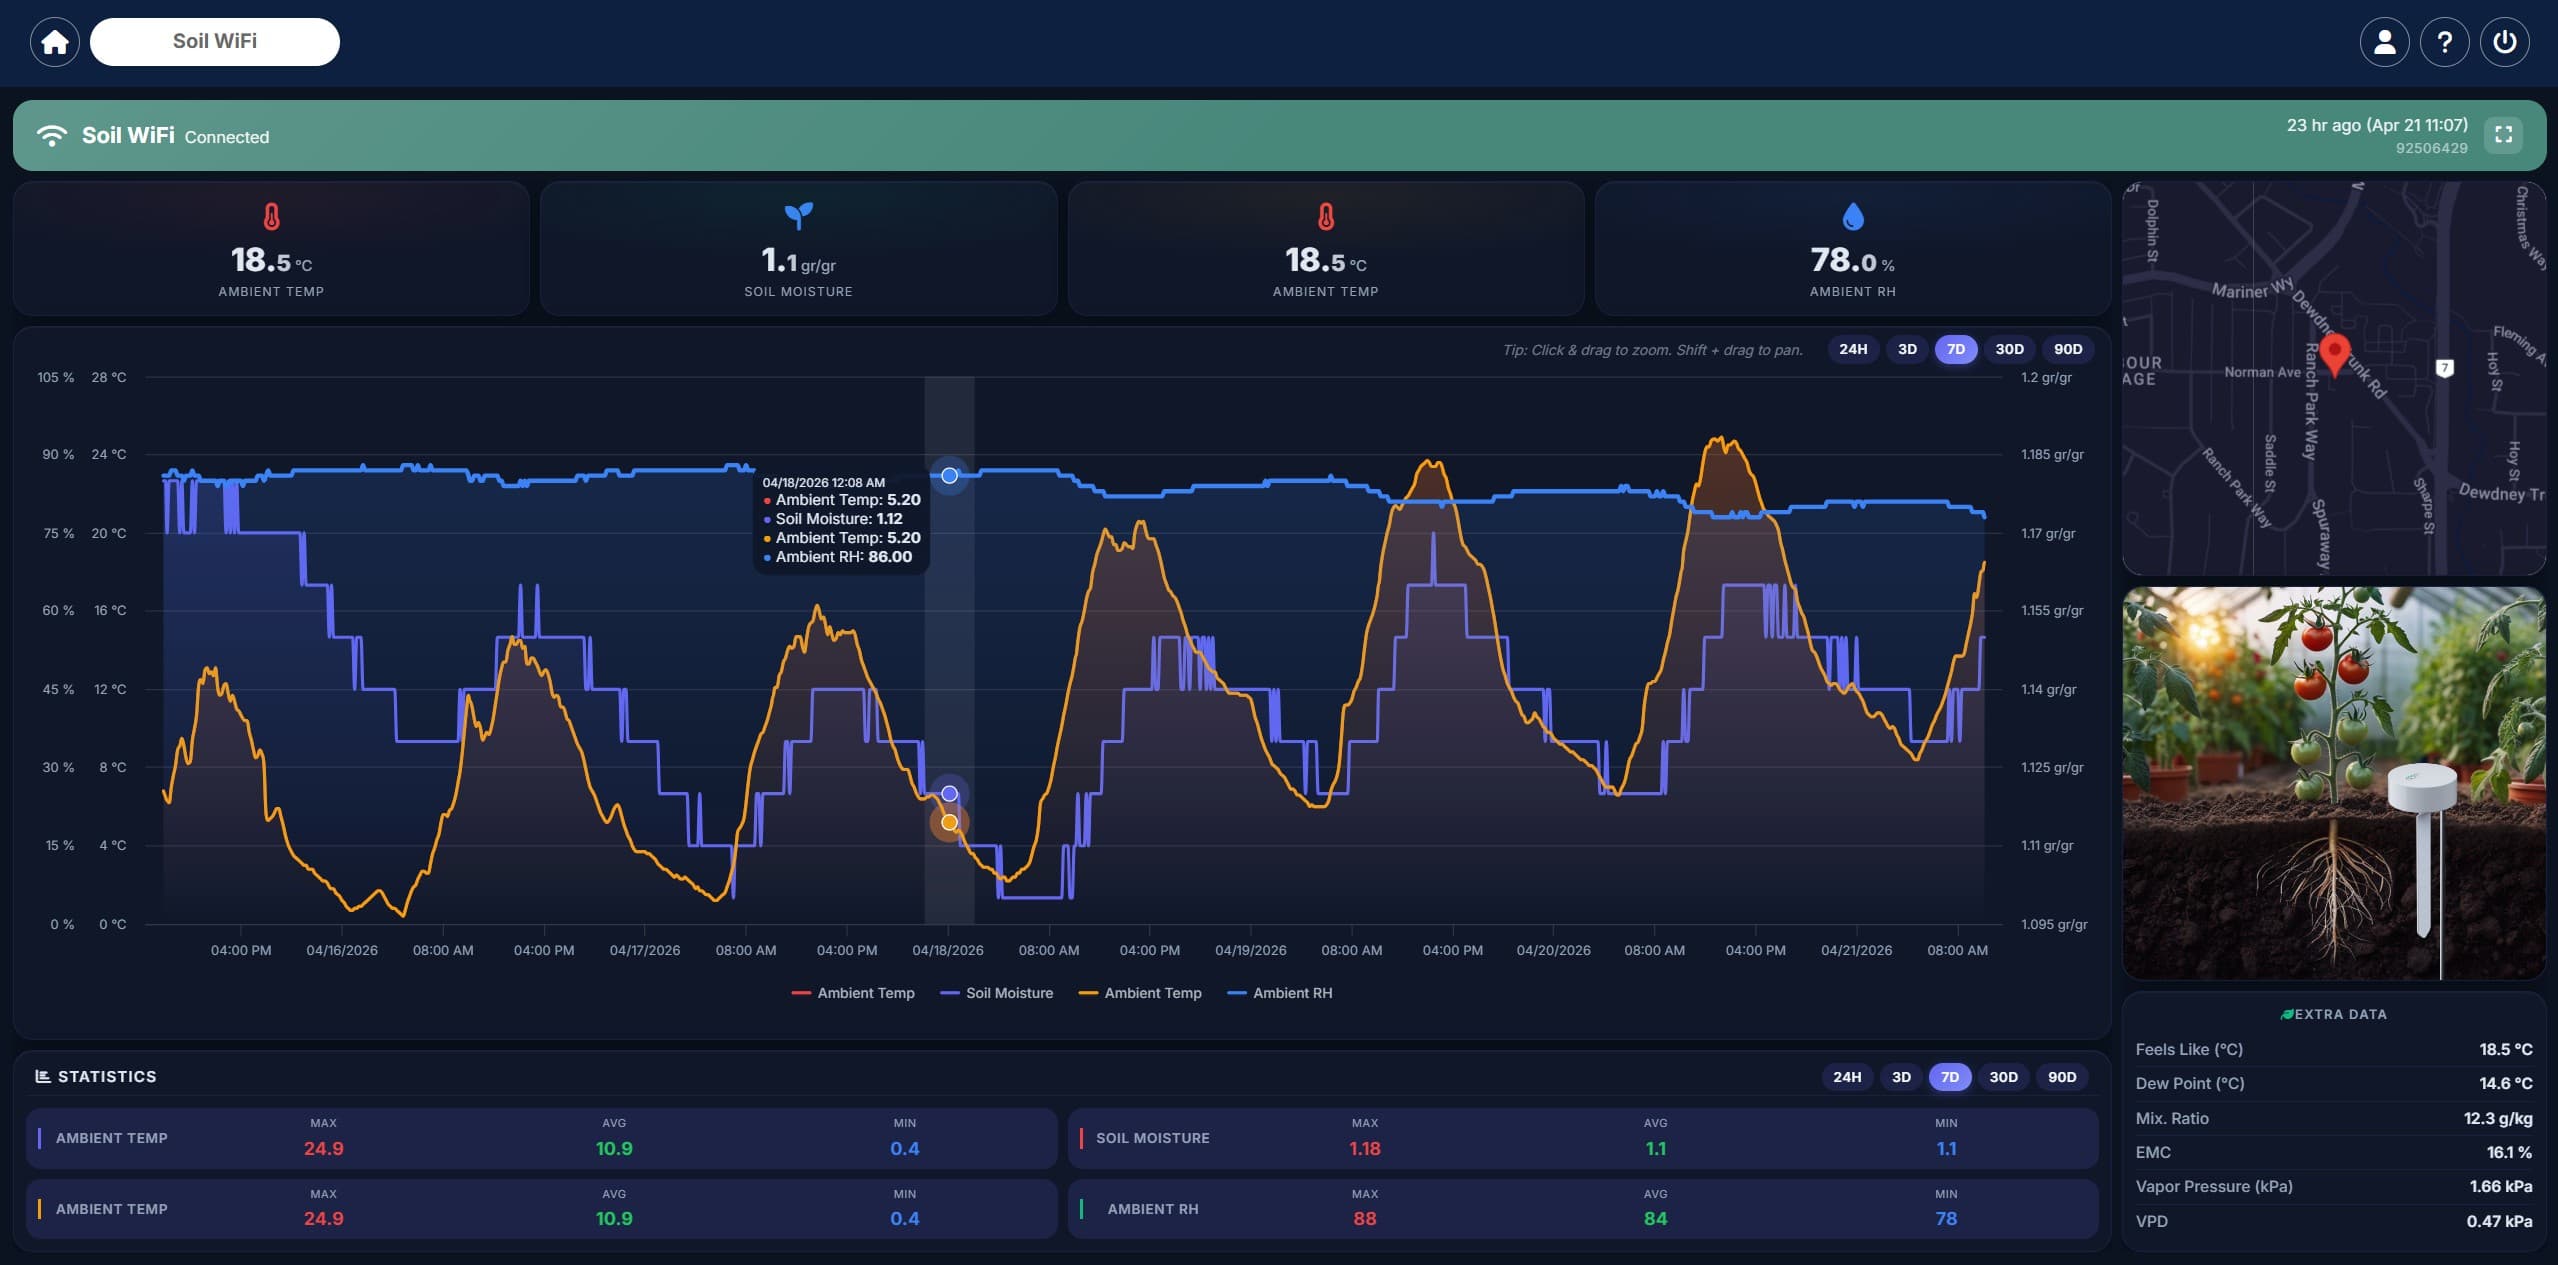
Pull and Push APIs let you retrieve sensor data and receive real-time alarm webhooks for ERP, BMS or custom systems. Viewer, Editor, Silent Viewer and Service & Maintenance roles give precise control over who sees and changes what, and automated utility sub-metering can allocate and bill usage. The MaxLinc web app scales from a single fridge to thousands of distributed assets.
See every sensor on one map, located by site.
Drill into historical trends with live, zoomable charts.
Every alert and action recorded for full traceability.
Calibration certs linked to each sensor serial number.
Viewer, Editor, Silent Viewer and Service access per device.
Allocate and bill water, power and gas usage automatically.
Retrieve data and receive real-time alarm webhooks.
Each user reads data in their own language and time zone.
Generated on the server and emailed on time, every time.
Locations, zones, assets, health scores and paired sensors.
Technician, parts, cost, downtime and warranty per visit.
Who saw the alarm, when, and what they did about it.
No. The MaxLinc web app is a progressive web app, so it runs in any modern browser on a phone, tablet or desktop. You can add it to your home screen so it behaves like an installed app and receives push notifications, but there is nothing to download from an app store and nothing to keep updated.
An unlimited number. Alarm recipients are set per device, and each recipient chooses their own channels — automated phone call, SMS, email or in-app push — in their own profile, in their own language and time zone.
Yes. Most report types can be scheduled to generate on a recurring basis and be emailed as a PDF, an Excel workbook or both, to everyone the device is shared with. Reports are built on the server, so a large export never ties up your browser, and you are notified if a scheduled report cannot be generated.
Every report renders in the browser and exports to a formatted PDF and a fully populated Excel (.xlsx) workbook, with charts in both. When a dataset is too large to print, the PDF shows the first rows and states the full row count, so a page limit is never mistaken for missing data.
Yes. The Multi-Sensor Data Consolidation report aligns devices that sample at different intervals into a single synchronized dataset, using either closest-record matching or linear interpolation, and exports it to Excel and PDF.
Viewer, Editor, Silent Viewer and Service & Maintenance. Viewers see everything and receive alarms, Editors can also change settings, Silent Viewers see everything with alarms switched off, and one designated Service & Maintenance partner per device can log repairs against the asset.
Two. A device activity log records every upload, alarm, message sent, setting change, report and sharing change; a user activity log records account-level actions such as sign-ins and profile changes. Neither can be edited or deleted from the interface, and owners and Editors can export the device log for any period.
It connects readings to the equipment they came from. You model your facility as locations, zones and assets, pair sensors to each asset, and the app maintains a health score, a service and repair history, a parts-and-cost record and a maintenance schedule for every one of them.
Twenty-four. Language and time zone are set per user rather than per account, so every member of a shared team reads the dashboard, the alarm messages and the reports in their own language.
In Canada, with daily backups and redundancy.
Every MaxLinc logger connects to the web app out of the box — no gateway, no app store, no subscription to get started.