Eleven water quality parameters on one device
Eleven water quality parameters, one device per site, and nobody drives out to read a panel. When a reading crosses your threshold, the alarm reaches a person by push, email, SMS or automated phone call.
The MaxLinc Data Concentrator connects on its own: cellular worldwide through its built-in eSIM, or your site WiFi — including a remote site whose internet arrives by Starlink.
- water quality parameters
- 11
- device per site
- 1
- ways an alarm reaches you
- 4
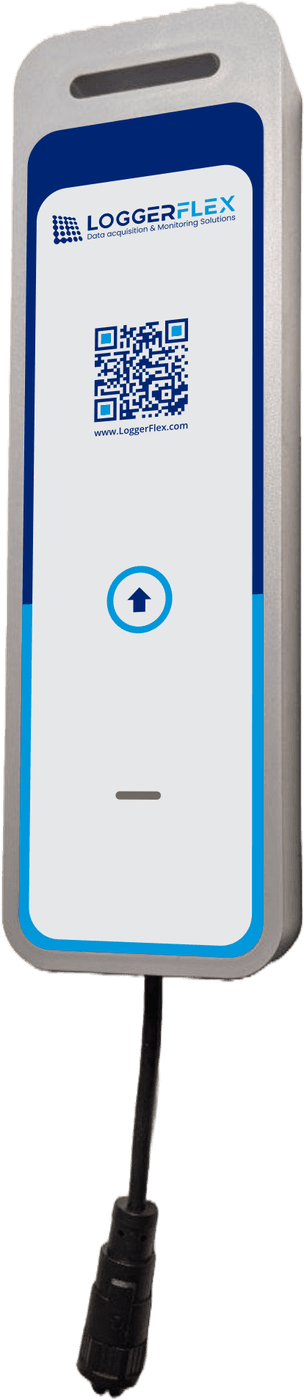
One device per site, every sensor on it
Probes in the water, one concentrator reading all of them, and the readings on your phone. No gateway, no PLC, no SCADA, no site IT.
- Probes in flow cells
- One concentrator
- Cellular or WiFi
- Your phone, and the record
Put the probes where the answer is
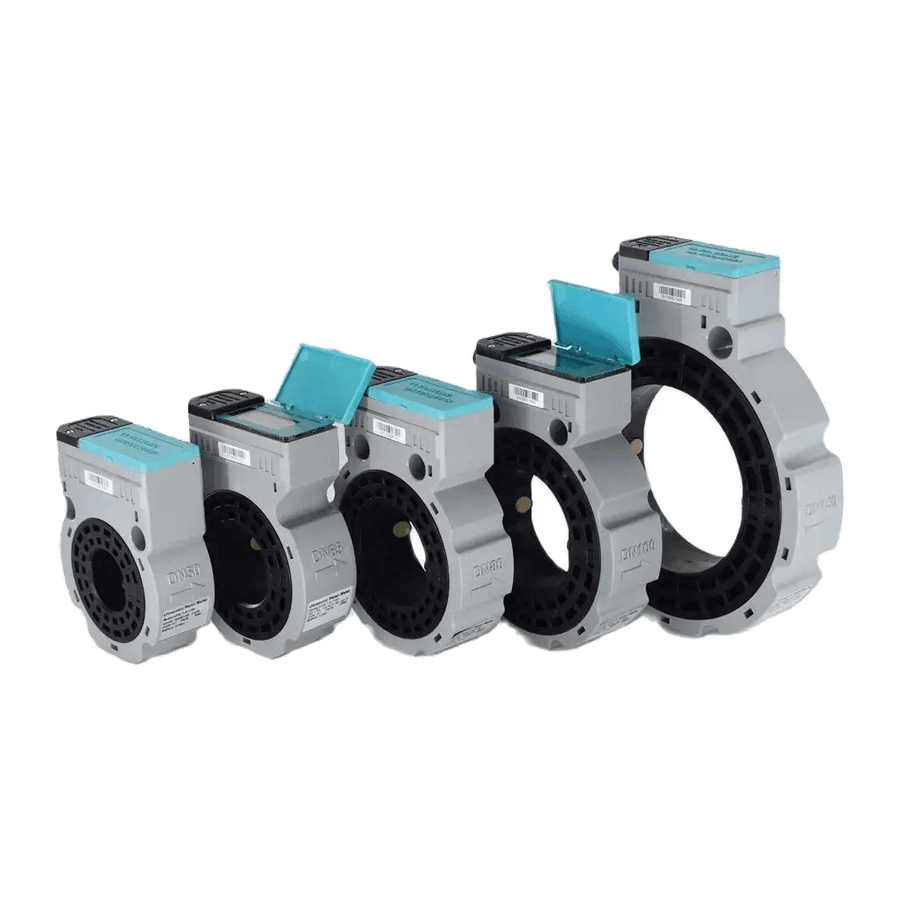
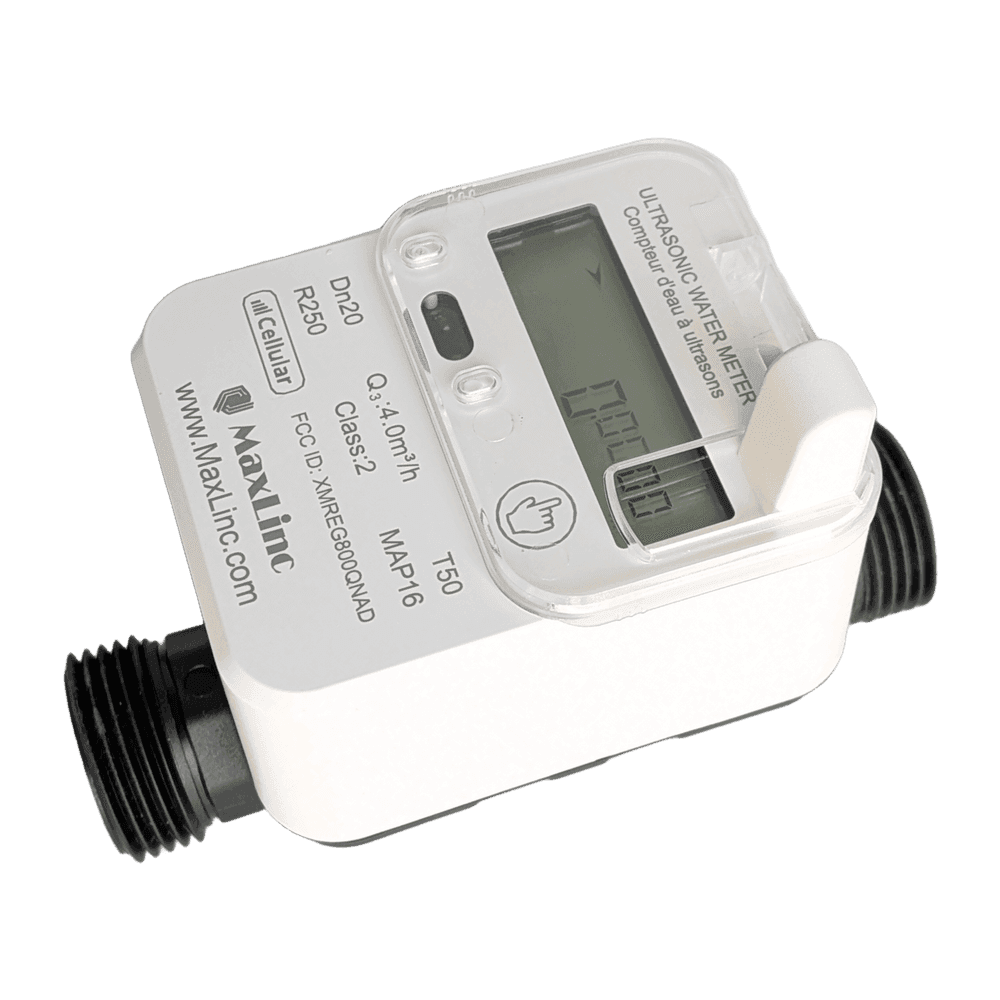
Every sensor is supplied with a flow cell, so the water is measured in a controlled stream instead of a turbulent channel. Mount that flow cell at the point that matters to you: the outfall, the intake, the return line, the tank, the well. Volume goes on the same site, with ultrasonic water meters from DN25 (1 in.) to DN150 (6 in.).
One concentrator reads them all
A single MaxLinc Data Concentrator reads every probe you selected and sends the data itself, over cellular using its built-in eSIM or over your site WiFi. The eSIM is not locked to one carrier or one country, so the same device reports from a Canadian outfall, a job site in the United States or a plant overseas, with no local SIM to source and nothing to swap when the site moves. Where there is no cellular signal at all it joins site WiFi instead — which is how a remote site reports over a satellite link such as Starlink. There is nothing between the probes and the cloud: no gateway to specify, no PLC to program, no SCADA project to schedule, and nothing for your IT group to approve. The cellular plan includes unlimited data.
Thresholds notify people, the cloud keeps the record
Set a threshold on any parameter and a breach notifies an unlimited number of recipients by push notification, email, SMS and automated phone call. Everything keeps logging in the background, with unlimited storage, advanced charts and reports, CSV and Excel export, and cumulative figures computed from the measured curve when you need to reconstruct an event. Premium software access is included.
None of this replaces accredited laboratory sampling: online sensors indicate and trend continuously between samples, and the results an authority enforces on still come from an accredited lab under your own permit or bylaw.
You run the parameters your site actually needs, not all eleven. Each entry says what the measurement physically is, and what decision it changes.
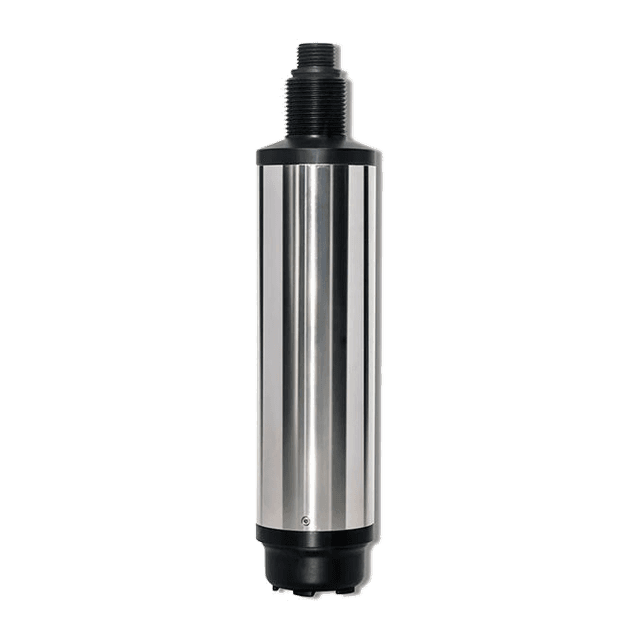
Dissolved Oxygen
Dissolved oxygen is the oxygen actually held in solution at the probe face, in milligrams per litre, which is what fish gills and the bacteria in a biological treatment process have to work with.
It decides whether somebody turns up aeration or drives out to a hatchery raceway at 04:00, because a warm, still night draws oxygen down while nobody is watching.
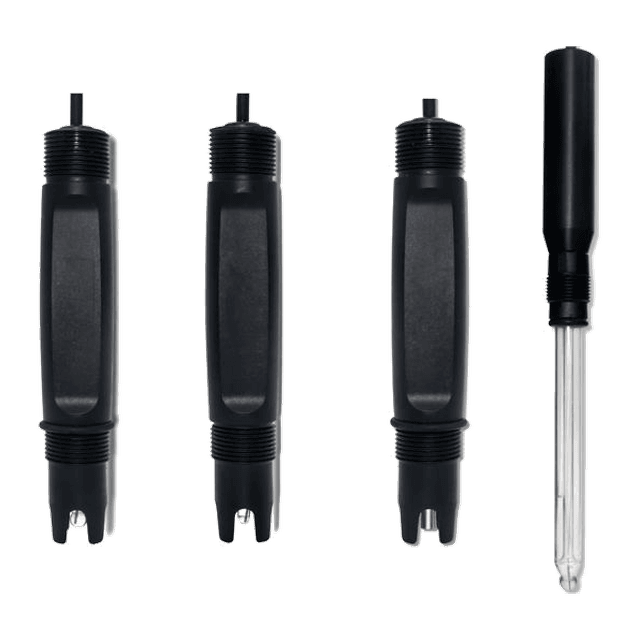
pH / ORP
pH is how acidic or alkaline the water is; ORP is the net oxidising or reducing tendency of that same water, read in millivolts.
Water that has touched fresh concrete on a construction site turns strongly alkaline, and pH is the measurement that tells you a discharge has moved outside the range written into your own permit or bylaw while there is still time to stop it reaching the ditch.
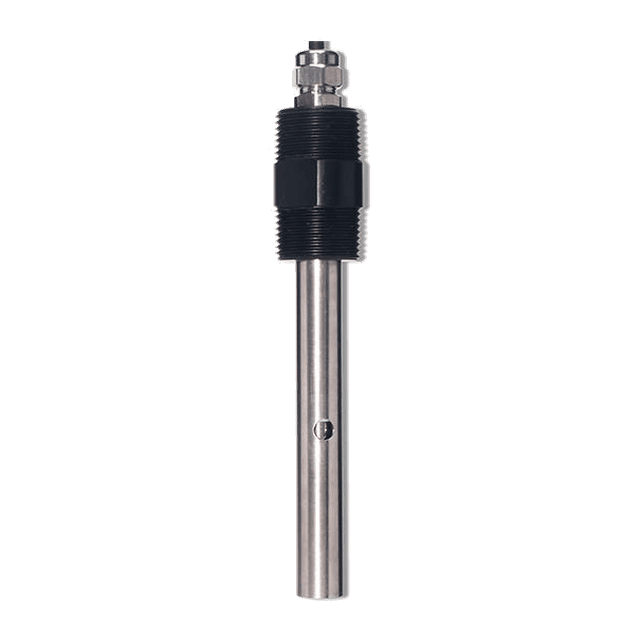
Conductivity / Salinity
Conductivity is how readily the water carries an electrical current, which rises and falls with the total load of dissolved ions present; it tells you how much salt is in the water and never which salt it is.
On a coastal or island well it is the earliest indication of saltwater intrusion, and on a sanitary collection system a drop in conductivity is a clean dilution tracer for stormwater finding its way into the pipe.
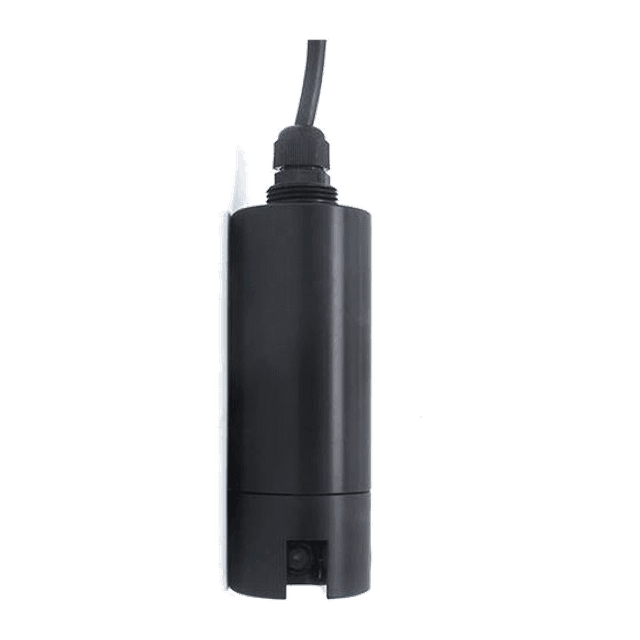
Turbidity
Turbidity is an optical measurement of how much light the particles in the water scatter, reported in NTU, so it is a measure of cloudiness and not a weight of anything.
It is what a construction or aggregate site watches at the outfall, because a rising trace through a rain event tells you which hour the sediment control gave way, while the number your authority acts on still comes from the sample your permit requires.
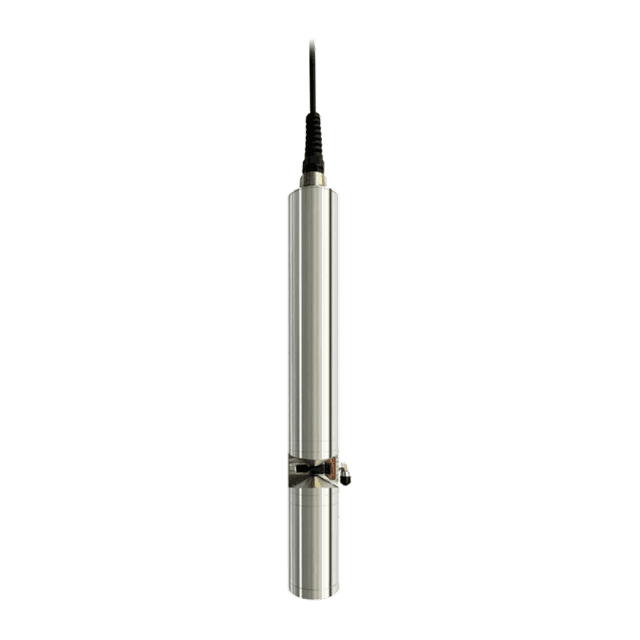
Suspended Solids (TSS)
Total suspended solids is a mass concentration in milligrams per litre, determined in a laboratory by filtering a sample and weighing the dried residue.
Where a bylaw or permit sets a TSS limit, it is normally written against that dry-weight laboratory determination, and the wording in your own bylaw or permit is the one that counts, so read it. The online probe works as a continuous estimate, correlated against your own site samples, that shows when the load arrived rather than replacing the laboratory result.
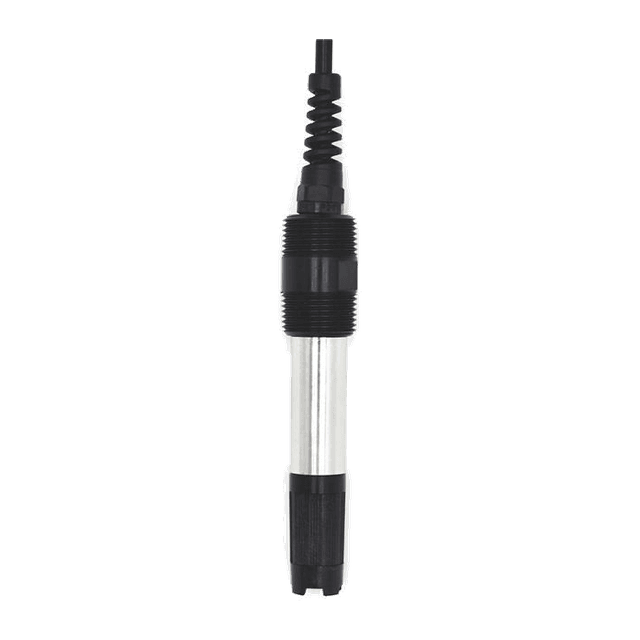
Residual Chlorine
It reads the chlorine residual still present in the water at that point, which is the disinfectant actually available there rather than the dose that went in upstream.
On a small drinking water system it shows the residual sagging at the far end of the distribution line overnight and points at which tap to sample. Your own drinking water authority decides what counts as an adverse result and which method or instrument it will accept, so the number of record stays with the instrument or laboratory it names, not with this sensor.
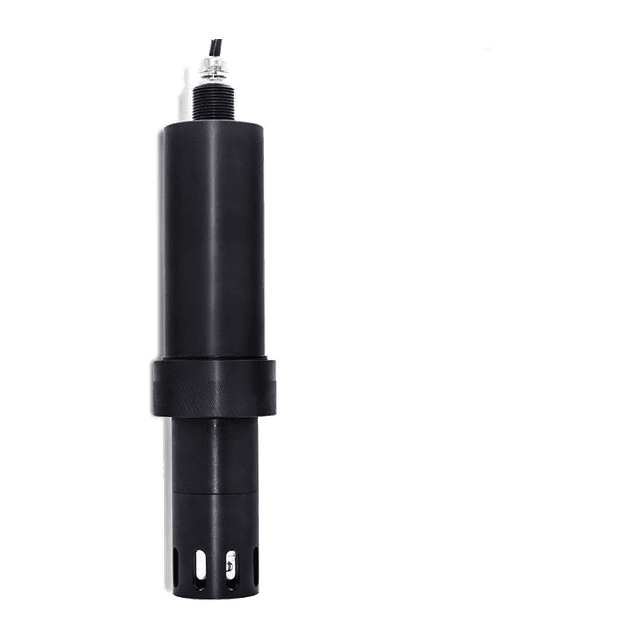
Ammonia Nitrogen
The probe reads total ammonia, which is the ionised ammonium and the un-ionised ammonia added together.
Only the un-ionised fraction is the toxic one, and that fraction climbs with pH and with temperature, so ammonia is read alongside pH and temperature at a lagoon discharge or a recirculating aquaculture tank to know whether today’s total is actually a problem.
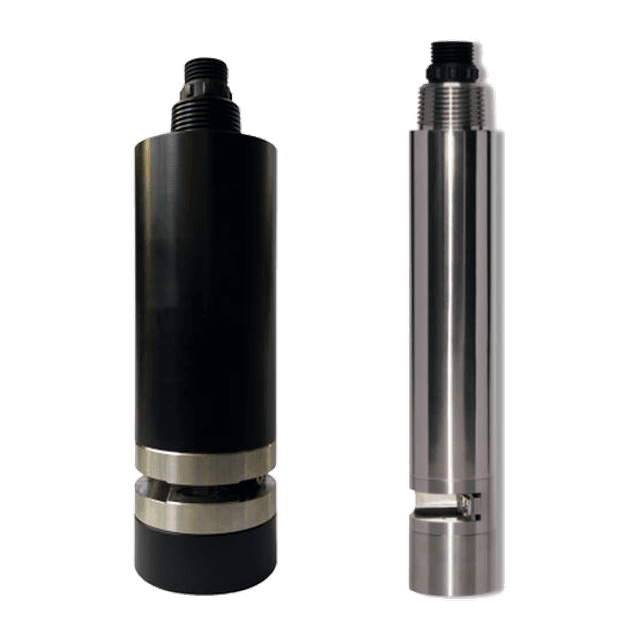
COD (Chemical Oxygen Demand)
COD is a fast surrogate for how much oxidisable organic material the water is carrying, available continuously instead of waiting days for a BOD5 result.
Once you have built a site-specific correlation between the probe and your own laboratory BOD5 results, it shows a strength spike arriving at a treatment plant or a receiving station hours before the lab could, which is while there is still time to hold or divert it.
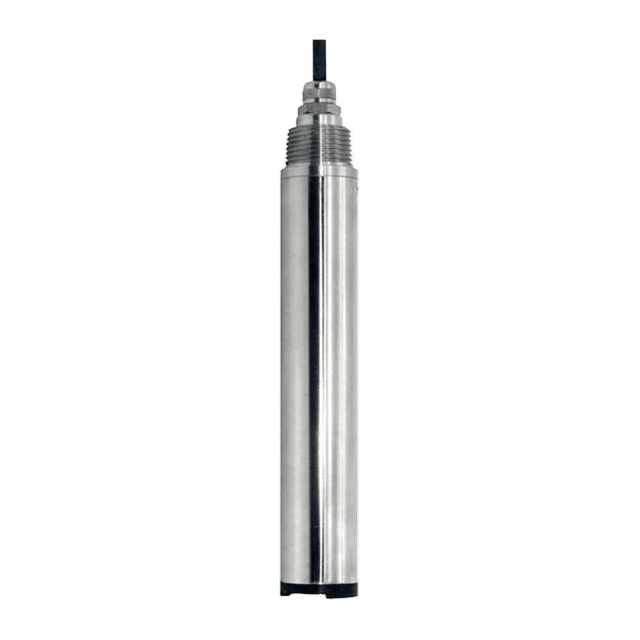
Chlorophyll / Blue-Green Algae
It measures the fluorescence of algal pigment in the water, chlorophyll and the phycocyanin associated with blue-green algae, which means it measures pigment and not toxin.
On a raw water reservoir, a dugout or a recreational pond a climbing pigment trace is the cue to attend and to have an accredited laboratory test for cyanotoxins, which this sensor cannot measure at all.
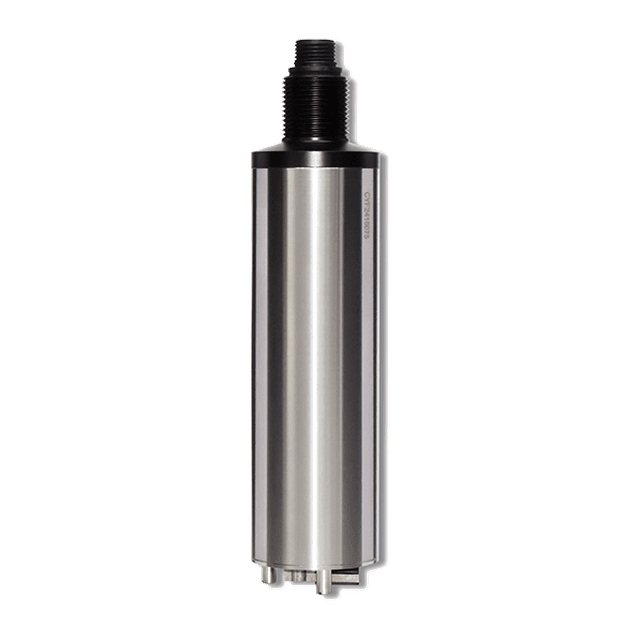
Oil in Water
This is a fluorescence measurement that responds to aromatic hydrocarbons in the water, not the solvent-extraction gravimetric method a laboratory runs for extractable hydrocarbons.
At a truck wash, a fuel yard or a stormwater oil and water separator it tells you an oily slug went through at 02:00, so you know the separator needs servicing and which hour to pull a sample for the lab.
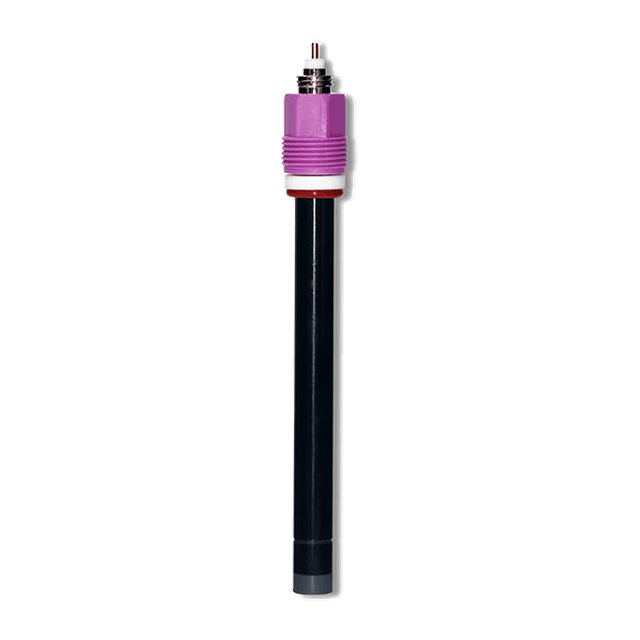
Calcium / Potassium Ion
This is an ion-selective measurement of one named ion, calcium or potassium, which is the thing conductivity can never give you, because conductivity sees only the total dissolved salt and not its composition.
In fertigation and recirculating nutrient solutions, potassium tells you whether the crop has drawn down the nutrient you actually dosed instead of only that the salt level still looks about right, and calcium is the hardness ion you follow for scale control on a membrane, a boiler feed or a cooling loop.
Every sensor is supplied with a flow cell, and one MaxLinc Data Concentrator reads any combination of them at a site.
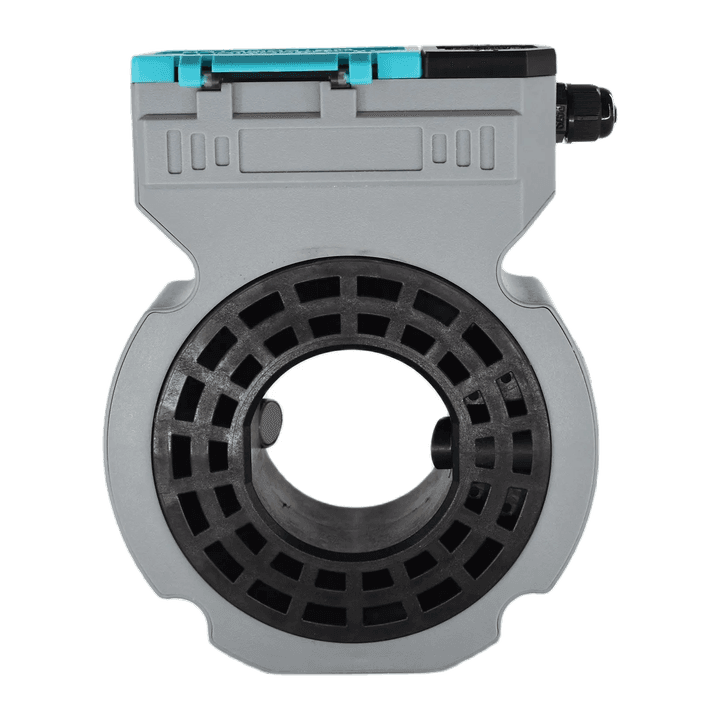
Volume comes from an ultrasonic water meter, DN25 (1 in.) through DN150 (6 in.). Ultrasonic measurement puts no impeller or paddle in the flow, so there is no moving part to wear out or to seize in gritty water. Quality and volume land on the same timestamped record, and that is what turns a concentration into a load.
DN25 (1 in.) to DN150 (6 in.)
One size range covers a service line, a wellhead, a lagoon discharge line or a plant feed. Above DN150 (6 in.), at a larger plant, an irrigation district header or a hatchery supply main, this is not the instrument, and we would rather say so now.
No moving parts to wear
Nothing spins in the water, so there is no impeller or paddle to foul, wear or jam. The measurement is made through the flow rather than by something the flow has to push.
Concentration times volume is load
A milligram per litre on its own is a concentration. With volume on the same record, the reports and charts overlay the two and can compute a cumulative figure across the event, the integral of the measured curve over time, which is what an event reconstruction or a damage assessment gets written from.
An inline meter needs a full, closed, pressurised pipe, with straight pipe upstream and downstream of it. An open channel, a ditch, a weir, a pond outfall, a gravity sanitary sewer, lay-flat hose or an open standpipe is out of scope for this meter, and what you get is your own dated operating record rather than a legal-for-trade or custody-transfer measurement.
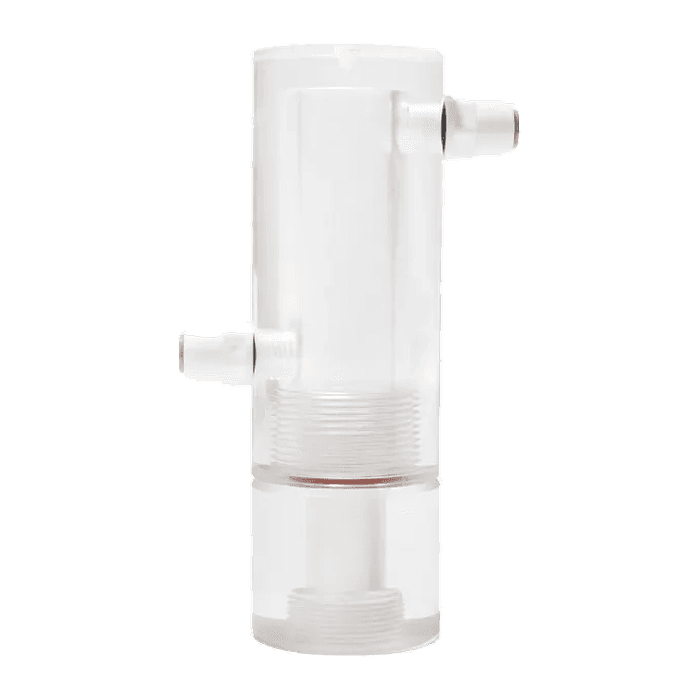
Every sensor is supplied with a flow cell. A flow cell is a small chamber that carries a side-stream of the process water past the probe face at a controlled rate, instead of putting the probe into the water body itself. That single change is what makes a reading repeatable, and what makes the probe maintainable by the person who has to maintain it.
A controlled side-stream past the probe face
The cell takes a side-stream off a tapped line and moves it across the sensing face at a set rate, so the probe always sees water arriving the same way. Same presentation every reading is the difference between a trace you can set a threshold against and one you argue about.
A representative sample, not whatever drifts past
An immersed probe reads whatever happens to be at its face: a stratified layer, a dead corner, a plume that has not mixed yet, a string of bubbles. Water drawn from the flowing line represents what is in the line, which is the number you meant to measure in the first place.
Less exposed than direct immersion
Direct immersion leaves an optical window or an electrode out in biofilm, settling solids, debris and physical knocks. Inside the cell the probe is enclosed and sees water that is moving rather than standing, which is a gentler place for a sensing face. Optical probes in solids-heavy water still need a documented cleaning routine wherever they are mounted.
Clean, calibrate or swap the probe at the wall
The probe sits in a cell at the wall, on a side-stream, rather than down in the water body. Cleaning, a calibration against a standard, or a full probe change is reached there, as a bench job at working height, and that is what lets a real calibration schedule survive contact with a busy site.
A flow cell needs somewhere to draw from and somewhere to send the water it has finished with: a tapped, pressurised line or a sample pump, plus a drain. That rules it out for a fair number of the points people want to monitor: in-stream, in a tank, in a dugout, in a stormwater basin, in a monitoring well. Those points are all workable, but they are a different deployment, with an immersed probe and a mounting designed for that site, and with the fouling, access and cleaning routine worked out before anything is installed. Tell us the point you actually have, rather than assuming the flow cell fits it.
A threshold breach does not stay on the site. It goes out to everyone you have listed, by push notification, email, SMS and automated phone call, at the moment it happens. Four channels rather than one, because the person who has to act at 03:00 is asleep, and an app badge does not wake anybody.
- One threshold crossing
- Four channels at once
- As many people as you list
Push notification
The channel that asks the least of the reader. It is the right notice for whoever is already on shift or already looking at the phone, and it names the parameter and the site, so you know what moved before opening anything. On its own it is a badge on a dark screen on a nightstand, which is exactly why it is not the only channel.
The written trace. An email is timestamped, searchable, and forwards cleanly to a consultant, a Qualified Professional or an engineer who was not on the original list, so the notice can become part of a file rather than a memory of a phone buzzing. It is also the channel that reaches a desk in the morning when the breach happened at a quiet hour and nobody needed to drive out.
SMS
A text lands on any phone, including a contractor’s or a relief operator’s, with no app to install and no account to set up. It gets through on a weak signal where a data connection stalls, and it sits on the lock screen until somebody reads it. This is the channel for the people who are adjacent to the site rather than in it.
Automated phone call
A ringing phone is the channel most likely to wake somebody who is asleep. When a residual chlorine reading drops on a small drinking water system, or turbidity climbs at an outfall in the middle of a rain event, the call is what turns a logged excursion into somebody putting boots on. This is the channel that closes the gap between an alarm sounding in an empty building and a person deciding what to do.
The recipient list is unlimited. Put the on-call operator on it, and the superintendent, and the outside consultant, and the owner, and the relief operator who covers two weekends a month, all at once. The list is not capped, so there is no limit to work around and no reason to keep it to one person who might be out of signal, on holiday or asleep.
You set the threshold for each parameter yourself, and crossing that threshold is what sends the notice — nothing else triggers it.
Every reading from every parameter is timestamped when it is taken and kept, so the question “what actually happened that night” has an answer with a shape to it. Premium software access is included, and it turns that log into charts, reports and exports. It is your record, in your hands, for as long as you want it.
- Peak NTU
- 52
- Mean NTU
- 27
- Above threshold
- 4 h 10
Every reading is kept
Continuous logging means an event is a curve rather than a scatter of grab samples. You can see when the excursion started, how high it went, when it came back and what the baseline looked like the day before, instead of inferring all of that from two bottles and the time somebody happened to be standing there.
Unlimited storage
Nothing rolls off to make room. Last spring is still there when a consultant asks about it next year, and the year before that is still there when somebody reconstructs a pattern across seasons. The record outlasts the staff who were on shift for it.
Trend charts and side-by-side overlays
Plot traces against each other: upstream against downstream, one filter against the other filter, one site against another. Where a use case needs an above-background comparison, this is where you see it — as two curves on one chart that a person reads, not as an automatic differential alarm.
Advanced reports, included
Premium software access comes with the system, so the reporting is not a tier you have to ask for later. The reports and charts run on the same continuous record, per parameter, over whatever period you choose. That is what makes a month of readings readable on one page instead of a wall of timestamps.
Cumulative totals over time
Reports can compute a cumulative figure — the integral of a measured curve over time — for event reconstruction and damage assessment. Because every reading is kept, you can also read an excursion straight off the curve: when it began, how high it went and how long it lasted.
CSV and Excel export
The record leaves the platform whenever you want it, in formats an engineer, a Qualified Professional or a consultant can open without asking anyone for access. What you send, to whom, and whether you send it at all stays your decision.
This is your own operating record. Online sensors indicate and trend; accredited laboratory results remain what an authority is normally enforcing on.
Cumulative load: the whole event, not one bottle
A grab sample tells you what the water looked like in one bottle, at one minute, at one point in the discharge. A continuously logged record lets you do something a bottle cannot: add the event up. Because one MaxLinc Data Concentrator logs every connected sensor on the same clock — turbidity, suspended solids and the ultrasonic volume meter together — the reports can integrate those readings over the life of a storm and give you a single cumulative figure for the event, beside the full curve it came from.
Two different numbers: exposure and mass
These are two different quantities, and they are easy to confuse. The first is a turbidity-time integral: the area under the turbidity curve. It needs only the turbidity sensor, and its units are NTU-hours. Six hours at an average of 120 NTU is 720 NTU-hours. It is an exposure proxy. It says how much turbid water passed and for how long. It says nothing about mass. The second is a true mass load in kilograms: the integral of concentration multiplied by flow rate over the event. It needs both a solids measurement and the volume meter. In working units, mass in kilograms is the sum over intervals of concentration in mg/L multiplied by volume in m³, divided by 1,000. So 300 m³ (about 66,000 imperial gallons) of discharge at a volume-weighted mean of 150 mg/L TSS is 45 kg, about 99 lb, of solids leaving the site. The distinction matters because duration is already written into Canadian guidance. The CCME Canadian water quality guideline for total particulate matter is expressed as an increase above background over a stated window: under clear-flow conditions, a maximum increase of 25 mg/L for a short-term exposure such as a 24-hour period, and a maximum average increase of 5 mg/L for longer exposures lasting from 24 hours to 30 days (Canadian Council of Ministers of the Environment, 1999 guideline; factsheet updated 2002). A guideline written that way cannot be evaluated from one reading. It is inherently a time-weighted question. It is also guidance rather than a limit in force by itself: provinces, territories and municipalities adopt, adapt or set aside guidance of this kind differently. The numbers that apply to you are the ones in your own permit, bylaw or authorization, not these.
How the integral is computed, and what limits its accuracy
The integral is a trapezoidal sum: each pair of consecutive readings is averaged, multiplied by the time between them, and the products are added. That is arithmetic, not modelling, and it is honest about one thing. The answer is only as good as the record underneath it. A continuous record is still a sequence of readings, and a trapezoid assumes the parameter moved in a straight line from one reading to the next. A short spike — a pump starting, a silt fence letting go — can sit between two readings and barely register in the total. So a cumulative figure belongs beside the record it was computed from, where the person reading it can see how much detail sits behind the number. The volume term is usually the better-behaved half. Volume that has passed is an additive quantity, so it is summed rather than inferred from the shape of a curve. The residual uncertainty in a mass load therefore sits almost entirely in the concentration term. Both terms are genuinely required. Peak concentration and peak flow are usually not coincident: sediment concentration commonly leads or lags discharge within a single event, the hysteresis documented for rivers by Williams (Journal of Hydrology, 1989). Multiplying a peak concentration by a total volume, or a mean concentration by a peak flow, can be wrong by a large factor in either direction. Only the paired, step-by-step product of concentration and volume is defensible. One siting note. A mass load requires the discharge to pass through the meter. That fits piped and pumped points — dewatering discharge, sump and settling-pond outfalls, a treatment train outlet — with ultrasonic meters from DN25 to DN150 (1 in. to 6 in.). Open sheet flow or an unstructured ditch has no pipe to meter, so a turbidity-time integral is available there and a mass load is not, unless a flume or weir is added by others.
Turbidity is an optical proxy, and the solids relationship is site-specific
Turbidity measures scattered light. TSS measures dry mass on a filter. The two correlate, but the conversion between them depends on the particle size distribution, shape, colour and mineralogy of that site’s sediment. Glacial silt, weathered till and organic-rich fill do not scatter light the same way per unit mass. That is why a generic conversion factor is not defensible, and why we will not hand you one. The accepted approach is set out in the USGS guidance for computing suspended-sediment concentrations and loads from in-stream turbidity sensors (Rasmussen and others, U.S. Geological Survey Techniques and Methods 3-C4, 2009): collect paired sensor readings and laboratory samples across the full range of flow and season at that site, fit a site-specific regression, and accept it only if its error statistic meets a stated criterion. So the honest reporting order is: first the raw turbidity record and its NTU-hour integral, which carry no assumptions; then a suspended-solids measurement, from the TSS sensor or from lab samples; then a mass load in kilograms, published together with the site-specific regression, its error statistic and the sample set behind it. A kilogram figure without that calibration record attached should be read as indicative only. Optical sensors also drift and foul. Every sensor is supplied with a flow cell, and a cleaning and calibration-check schedule belongs in the site plan, because the integral silently inherits every bit of drift across the whole event. Maintenance records are part of the data quality, not paperwork around it.
What the cumulative figure is genuinely for
Event reconstruction. When a complaint arrives four days after a storm, you have the whole curve with timestamps — start, peak, duration and total — instead of an argument about whether one bottle was representative. Storm-to-storm comparison. Same site, same sensor, same calculation: last month’s event and this one are like-for-like, which is what makes it possible to see whether a control measure changed anything. Apportioning between adjacent dischargers. Where there is a monitored point above and below on a shared receiving water, the reports and charts can overlay the two records and integrate each over the same window, so the discussion about who contributed what happens in numbers rather than by assertion. The comparison is one you read off the charts; it is not an automatic calculation between devices. Showing a whole event rather than one moment. A complete time series plus a total is a different conversation with a regulator, an insurer or a neighbour than a single reading, particularly where the guideline being discussed is itself written as an average over a window, as the CCME suspended-sediment guideline is (CCME, 1999 guideline; factsheet updated 2002). On thresholds, note how much they move. In its federal rule for construction and development discharges, the US EPA adopted a numeric 280 NTU limit in 2009, stayed it in 2010, and withdrew it from the rule in 2014. That is United States federal history, not Canadian, and it is here only to show how far a number can travel. Read the number you configure off your own current authorization, and check it again when that authorization is renewed.
What the figure is not
It is not an accredited measurement. Online sensors indicate and trend; the result an authority enforces on is almost always laboratory analysis of a properly collected sample, by an accredited laboratory, using the prescribed method. Continuous monitoring supplements that sampling. It does not replace it, and we do not offer this system as a compliance instrument. It does not, by itself, establish liability, damage or a breach in law. A total in NTU-hours or kilograms is evidence of what was measured, at one point, with one sensor, at the resolution of the record behind it. Who is responsible, and what harm followed, is a determination for the regulator, the courts, or the parties and their experts, informed by a record of which this is one part. And it is a calculated estimate, not a reading. Change the detail in the record behind it, the condition of the sensor, or the turbidity-to-solids regression, and the number changes. Publish those three things with the figure so the person checking your work can see exactly what they are checking.
Treat a cumulative figure as what it is: arithmetic performed on your own logged data, no stronger than the data underneath it. It depends on how much detail the record behind it carries, on the calibration and cleanliness of the sensor during the event, and, for any figure in kilograms, on a turbidity-to-solids relationship calibrated against laboratory samples from your own site and season. We make no claim that using this system achieves or maintains regulatory compliance, and we do not tell you what limits apply to you. Numeric thresholds and averaging windows are jurisdictional: they come from your permit, your municipal bylaw or your provincial or federal authorization, they differ between neighbouring jurisdictions, and they change between years. Where a compliance result is required, that remains accredited laboratory analysis of a properly collected sample.
- Canadian Council of Ministers of the Environment, Canadian Water Quality Guidelines for the Protection of Aquatic Life — total particulate matter (suspended sediment): 1999 guideline, factsheet updated 2002. Clear-flow conditions: short-term exposure, maximum increase of 25 mg/L above background; 24 hours to 30 days, maximum average increase of 5 mg/L above background.
- Rasmussen, P.P., Gray, J.R., Glysson, G.D., and Ziegler, A.C., 2009, Guidelines and procedures for computing time-series suspended-sediment concentrations and loads from in-stream turbidity-sensor and streamflow data: U.S. Geological Survey Techniques and Methods, book 3, chapter C4.
- Williams, G.P., 1989, Sediment concentration versus water discharge during single hydrologic events in rivers: Journal of Hydrology, volume 111, pages 89 to 106.
- United States Environmental Protection Agency, Effluent Limitations Guidelines and Standards for the Construction and Development Point Source Category (United States federal rule): 280 NTU numeric turbidity limit promulgated 2009, stayed 2010, withdrawn from the rule 2014.
Eleven use cases, each with the parameters that actually earn their place. Open the ones that look like your site.
Construction stormwater, watched overnight
The ESC supervisor, superintendent and Qualified Professional who carry the after-hours phone on an active site.
4 parametersVolume meter
Construction stormwater, watched overnight
The ESC supervisor, superintendent and Qualified Professional who carry the after-hours phone on an active site.
4 parametersVolume meter
The problem
Sediment-laden water leaves site during the storm, but inspection runs on a calendar. Surrey’s erosion and sediment control bylaw requires routine inspection every 7 days in the wet season on active non-single-family sites, and requires the ESC Professional to inspect within 24 hours of a rainfall event of more than 25 mm in 24 hours and report within 48 hours (City of Surrey Bylaw No. 21181, 2024). A discharge that starts at 03:00 on a Sunday can run its whole course before anyone is on site, and the handheld reading taken Monday describes water that is already in the creek.
What changes
A concentrator at the discharge point reads turbidity and pH continuously and logs every reading, so you know which hour to attend instead of reconstructing it afterwards. Where your limit is written as an increase above background, a second station upstream gives you the background trace, and the two appear as an overlay in the reports rather than as an automatic alarm. On a full closed pipe an ultrasonic meter puts volume on the same timestamped record as quality, and the reports can compute a cumulative figure over the event. One honest boundary: Coquitlam’s Schedule D requires a real-time monitoring facility to shut off discharge automatically and recirculate at defined limits, and requires the provider to come from the City’s pre-qualified list and to be unaffiliated with the site’s treatment, ESC supervision or Qualified Professional contractors (City of Coquitlam Bylaw No. 4403, 2013, Schedule D, consolidated to Bylaw 5454, 2025); this system measures, logs and notifies, so it does not by itself satisfy that schedule.
Alarm example: Turbidity at the outfall crosses the absolute limit written into your own bylaw or authorization, and that crossing goes out at once by push notification and SMS to the on-call ESC supervisor and the superintendent, by email to the Qualified Professional and the developer’s environmental lead, and by automated phone call to anyone who has to be reached by voice.
Your turbidity, TSS and pH numbers and your inspection interval come from your own municipal bylaw and site authorization rather than any national figure, and total suspended solids is defined as a laboratory determination, so a continuous turbidity trace is a screening and timing tool and not the number an authority enforces on.
- City of Surrey, Erosion and Sediment Control Bylaw No. 21181, 2024
- City of Coquitlam, Stream and Drainage System Protection Bylaw No. 4403, 2013, Schedule D, consolidated to Bylaw 5454, 2025
- Toronto and Region Conservation Authority / Sustainable Technologies Evaluation Program, Erosion and Sediment Control Guide for Urban Construction, 2019
Remote and Indigenous community drinking water
Water system operators and public works managers at small and remote community systems.
5 parametersVolume meter
Remote and Indigenous community drinking water
Water system operators and public works managers at small and remote community systems.
5 parametersVolume meter
The problem
The gap is usually notification rather than instrumentation. The federal protocol already requires Community Systems to test chlorine residual with continuous monitoring equipment equipped with an alarm and to have continuous monitoring on each filter effluent line, while Small Community Systems are exempt and rely on daily tested samples instead (Aboriginal Affairs and Northern Development Canada, Protocol for Centralised Drinking Water Systems in First Nations Communities, 2010, now published by Indigenous Services Canada), and an alarm panel that rings in a building nobody is in is not a notification. Residual also falls with water age, and maintaining it is recognized as difficult in low-flow areas such as dead ends and the far parts of a distribution system (Health Canada, Chlorine guideline technical document, 2009), so a weekly grab at a convenient tap can read fine while a quiet loop sits below the minimum for days. In 2023, 89 per cent of boil water advisories in the national dataset were issued for systems serving 500 people or fewer and 87 per cent were due to equipment- and process-related problems, on an indicator covering less than half the Canadian population (Environment and Climate Change Canada, 2025).
What changes
A concentrator at the treatment building logs filter-effluent turbidity, treated-water chlorine residual and pH continuously against the targets written into that system’s own approval, and a second unit holds the same trend at the far end of the distribution system, reporting over cellular with no SCADA and no site IT. A sensor does not repair a filter, build a plant or stand in for an operator. What it changes is time-to-know and the record: the reading is timestamped when it happens instead of being discovered at the next walk-through or the next drive-out, breaches reach whoever the community puts on the list by push notification, email, SMS and automated phone call, and the continuous log and its CSV or Excel exports are there whenever the community needs them. The accredited sampling the health authority relies on still has to happen.
Alarm example: Free chlorine at the north-loop kiosk falls below the minimum written into your own approval, and that crossing reaches the on-call operator by push notification and SMS, the public works manager by email, and any further contact the community names by automated phone call.
The residual and turbidity numbers that bind you come from your own approval and your responsible authority, which varies by province, territory and system type, and this is not an approved or regulatory analyzer, so the accredited sampling your health authority enforces on is unchanged.
- Aboriginal Affairs and Northern Development Canada, Protocol for Centralised Drinking Water Systems in First Nations Communities, 2010 (now published by Indigenous Services Canada)
- Environment and Climate Change Canada, Canadian Environmental Sustainability Indicators: Boil water advisories, 2025
- Health Canada, Guidelines for Canadian Drinking Water Quality: Chlorine, 2009
Filters and distribution, after hours
Chief operators and distribution supervisors at plants that are not staffed around the clock.
6 parametersVolume meter
Filters and distribution, after hours
Chief operators and distribution supervisors at plants that are not staffed around the clock.
6 parametersVolume meter
The problem
Individual filter effluent turbidity is the working surrogate for the plant’s pathogen barrier, and at many small and mid-size plants it is read off a panel by whoever happens to be in the building. Breakthrough that starts at 03:00 on a Saturday is found on the next round, and the shape of the post-backwash ripening peak, its height and how long it lasts, is only visible with continuous logging. In distribution, residual gets measured where it is easiest to reach and is lowest where nobody goes, and in a chloraminated system nitrification is a recognized distribution-system problem: Health Canada asks for monitoring at locations throughout the system, including storage facilities and areas of low flow and high water age (Health Canada, Chloramines guideline technical document, 2020), which are the places nobody visits.
What changes
One concentrator reads the plant’s turbidity, residual chlorine and pH probes continuously and writes every reading to a record nobody has to transcribe, with thresholds set to the values written into that plant’s own approval. Health Canada asks conventional and direct filtration to hold 0.3 NTU or less in at least 95 per cent of measurements per filter cycle or per month and never above 1.0 NTU (Health Canada, Turbidity guideline technical document, 2012), and only a continuous trace shows you where you actually sit against a percentage like that. Treated volume on the same record lets you read turbidity against how hard the filters are being run, and a unit at a reservoir or at an end-of-line sampling point holds a continuous residual, ammonia and pH trend at the location that otherwise gets sampled monthly, so the seasonal shape of a residual problem becomes something you can show. This is process visibility, not a regulatory analyzer.
Alarm example: Filter 3 effluent crosses the 0.3 NTU value written into your own approval at 03:12, and that crossing goes to the on-call operator by push notification and SMS, to the plant supervisor and utility manager by email, and by automated phone call to the after-hours number.
Your turbidity and residual limits come from your own approval, permit or operating authorization, and in Ontario an adverse result attaches to a regulatory analyzer carrying its own approval, calibration and record requirements (Ontario Ministry of the Environment, Conservation and Parks, Residual chlorine analyzers technical bulletin, Issue 4, 2012), which this system is not.
- Health Canada, Guidelines for Canadian Drinking Water Quality: Turbidity, 2012
- Ontario Regulation 170/03 under the Safe Drinking Water Act, Schedule 6 s. 6-5, 2003
- Health Canada, Guidelines for Canadian Drinking Water Quality: Chloramines, 2020
Source water at the intake
Plant superintendents and source-water leads drawing from rivers, lakes and reservoirs.
7 parameters
Source water at the intake
Plant superintendents and source-water leads drawing from rivers, lakes and reservoirs.
7 parameters
The problem
Coagulation is tuned for the water you had yesterday, and raw water changes faster than a daily grab sample sees it. Wildfire changes source water quality through the build-up of ash, soil erosion and fire debris, shifting nitrate, ammonia, phosphate, total suspended solids, turbidity and temperature (HealthLink BC, Wildfire: its effects on drinking water quality, 2024). After the 2003 Lost Creek fire in southwestern Alberta, 95th-percentile stream turbidity was 15.3 NTU in streams draining burned watersheds and 18.8 NTU in salvage-logged watersheds, against 5.1 NTU in unburned reference watersheds (Emelko et al., Water Research, 2011). In bloom season the same intake can start drawing cyanobacteria with nothing between weekly samples.
What changes
Continuous turbidity, conductivity, pH, ammonia and blue-green algae fluorescence at the intake give you a measured trend, instead of one number from this morning and a look at the water surface. Fluorescence indicates pigment and biomass, not toxin: Health Canada’s seasonal maximum acceptable concentration of 0.0015 mg/L for total microcystins is confirmed by laboratory analysis of samples (Health Canada, Cyanobacterial Toxins guideline technical document, 2018), so what the trend gives you is an objective prompt for when to collect that sample. Left on an intake or a well through a recovery period, the same log becomes your multi-season record between approved-laboratory tests, which matters because a UBC-led review of 23 studies across 28 watersheds found wildfire water-quality effects often intensify months or years after a fire, with some phosphorus increases persisting more than 14 years downstream (UBC-led review in Science of the Total Environment, 2026, reported by UBC News, 2026). Charts overlay parameters across seasons, and the reports can compute a cumulative figure over an event.
Alarm example: Blue-green algae fluorescence at the intake crosses a trigger you set yourself, and that crossing reaches the on-call operator by push notification and SMS, the plant superintendent by email, and the system owner by automated phone call.
There is no national raw-water limit: your treatment obligations and any advisory trigger come from your provincial or territorial drinking water officer, permit or approval, and boil-water and do-not-use decisions rest with the health authority on approved-laboratory results rather than on an online reading.
- HealthLink BC, Wildfire: its effects on drinking water quality, 2024
- Emelko, Silins, Bladon and Stone, Implications of land disturbance on drinking water treatability in a changing climate (Water Research 45(2)), 2011
- Health Canada, Guidelines for Canadian Drinking Water Quality: Cyanobacterial Toxins, 2018
- University of British Columbia, review of post-wildfire effects on surface drinking water sources (Science of the Total Environment), 2026, reported by UBC News, 2026
Wells, intrusion and metered withdrawal
Small-system operators, coastal well owners and licence holders who file withdrawal returns.
5 parametersVolume meter
Wells, intrusion and metered withdrawal
Small-system operators, coastal well owners and licence holders who file withdrawal returns.
5 parametersVolume meter
The problem
British Columbia advises a coastal well owner to analyse one sample a year for chloride, electrical conductivity and TDS, preferably in the dry season, and to track the change over time (B.C. Well Drilling & Operation Advisory: Risk of Sea Water Intrusion, Southern Gulf Islands, October 2023). One point a year cannot see conductivity climb through a hot August of heavy irrigation, and that same advisory states sea water intrusion may be permanent or take many years to reverse. A pump starting against a drawn-down column pulls fines and reduced iron with it, and the complaint arrives as brown laundry water hours later, once the well is running clear again. A licensed withdrawal is often still known only as pump hours times an assumed rate, although Ontario permit holders must record the volume of water taken daily at each source and report it on or before March 31 for the previous calendar year (O. Reg. 387/04 under the Ontario Water Resources Act, 2004).
What changes
A conductivity cell in a flow cell on the discharge line logs continuously while the pump runs. A B.C. factsheet on preventing saltwater intrusion describes this class of arrangement, an in-line conductivity meter installed in the discharge line, paired there with an automated shut-off if conductivity rises above a set level, offered as an example at 900 microsiemens per centimetre and not as a legal number (B.C. Ministry of Forests, Lands and Natural Resource Operations, March 2016); MaxLinc supplies the measurement, the record and the notification, not the shut-off. Turbidity and a residual-chlorine probe downstream of disinfection, on the same concentrator, record the start-up period and show whether disinfectant survived it. An ultrasonic meter on the discharge main turns pump hours into a dated per-day volume with CSV and Excel export, which is your operating record and not a certified custody-transfer measurement.
Alarm example: Electrical conductivity on the discharge line crosses the value your operator sets, and the alert goes out by automated phone call, SMS, push and email to the operator on shift, the water committee chair and the consulting hydrogeologist.
Chloride and TDS are confirmed by an accredited laboratory, the thresholds that bind you are the ones written into your own licence, permit or provincial advisory rather than a national number, and keeping this record does not by itself discharge a reporting obligation.
- B.C. Ministry of Forests, Lands and Natural Resource Operations, Best Practices for Prevention of Saltwater Intrusion, March 2016
- B.C. Ministry of Forests and Ministry of Water, Land and Resource Stewardship, Well Drilling & Operation Advisory: Risk of Sea Water Intrusion, Southern Gulf Islands, B.C., October 2023
- Government of Ontario, Water Taking and Transfer (O. Reg. 387/04 under the Ontario Water Resources Act), daily records and the March 31 annual report, 2004
Lagoons and small wastewater plants
Municipal, regional district and First Nation wastewater operators, and the contract operators covering several plants.
8 parametersVolume meter
Lagoons and small wastewater plants
Municipal, regional district and First Nation wastewater operators, and the contract operators covering several plants.
8 parametersVolume meter
The problem
A small continuously discharging system whose effluent averages 2,500 cubic metres a day or less may be sampled just once a month, each grab or composite taken at least 10 days after the previous one (Wastewater Systems Effluent Regulations, SOR/2012-139, s. 10, 2012), so most of the month is unmeasured, and a five-day BOD5 result lands after a controlled lagoon release has already finished. A blower trip, a clarifier washout, a septage slug or a cold snap moves effluent between those bottles. In two Canadian Prairie lagoons followed through a full year, nutrients were not removed through winter and release was observed instead, with removal resuming at the spring awakening of biological activity (Journal of Environmental Management, 2018), so a winter number and a June number are not the same process. In the collection system, rainfall-derived inflow and infiltration fills hydraulic capacity with clean water, and you know flow is up without knowing whether it is sewage or stormwater.
What changes
Process state becomes visible on the days nobody is sampling: dissolved oxygen in the aeration basin, ammonia breaking through, COD as a fast organic-load surrogate, effluent solids or turbidity, and pH through a whole release rather than at the one moment somebody dipped a bottle. Conductivity works as a dilution tracer for inflow and infiltration, a published method quantifying rainfall-derived inflow from the conductivity difference between base wastewater flow and the cleaner water diluting it (Zhang et al., Journal of Hydrology, 2018), and one concentrator covers one point at a time, so you take a sub-catchment through a wet season in turn. The reports and charts put two points on one overlay for you to compare by eye, and a cumulative figure over a release period lets you reconstruct the event afterwards. Be precise about the limits: an ammonia probe reads total ammonia, while the federal value, where that schedule applies to your system, is written for un-ionized ammonia at 15 degrees C (SOR/2012-139, s. 6, 2012), and converting one to the other takes pH and temperature, so the probe trend indicates rather than settles it. COD also needs a site-specific correlation before it says anything about BOD5.
Alarm example: Dissolved oxygen in the aeration basin falls below the value you set, and the alert goes out by push, SMS, email and automated phone call to the contract operator on shift and the public works supervisor.
The numbers that bind your plant come from your own Environmental Compliance Approval, provincial regulation or the federal schedule that applies to your system rather than from one national figure; temperature is not part of this sensor set, so an un-ionized ammonia value has to be produced elsewhere; and the regulated result is still an accredited laboratory sample. These probes indicate and trend.
- Government of Canada, Wastewater Systems Effluent Regulations (SOR/2012-139), s. 6 effluent quality and s. 10 sampling frequency, 2012
- Journal of Environmental Management, Seasonal variations in cold climate nutrient removal: a comparison of facultative and aerated lagoons, 2018
- Zhang et al., Journal of Hydrology, Quantifying rainfall-derived inflow and infiltration in sanitary sewer systems based on conductivity monitoring, 2018
Onsite septic: instrument the treated effluent
Strata, resort, campground and school owners with large onsite systems, and the registered practitioners who hold the maintenance plan.
7 parametersVolume meter
Onsite septic: instrument the treated effluent
Strata, resort, campground and school owners with large onsite systems, and the registered practitioners who hold the maintenance plan.
7 parametersVolume meter
The problem
Start with what is not a measurement point: the raw anaerobic septic tank. Ontario design guidance tabulates septage at BOD5 400 to 78,600 mg/L and TSS 300 to 93,400 mg/L (Ontario Ministry of the Environment, Design Guidelines for Sewage Works, Table 19-1, 2008), and no probe in this set belongs in that. What actually fails, and what gets an owner ordered to stop discharging, sits downstream: effluent breaking through a sand filter, a blower that tripped on Friday and was found on Monday, a campground on a long weekend pushing far more flow through a plant sized for a quiet week, and a distribution field beginning to fail while the treatment train still looks fine. None of that announces itself to a maintenance visit scheduled for next month.
What changes
Instrument the treated side: the discharge of a Type 2 or Type 3 plant as British Columbia classifies treatment (Sewerage System Regulation, B.C. Reg. 326/2004), the sand-filter outlet or the pump chamber, where a flow cell can be fed from a pressurised line. Dissolved oxygen tells you the blower is still moving air, turbidity or suspended solids show breakthrough, total ammonia read alongside pH shows whether the plant is still nitrifying, and a meter on the pump discharge shows a long-weekend hydraulic overload while it is happening rather than as a soggy field afterwards. A conductivity cell on the treated effluent and another on the nearby well give you a tracer you can lay side by side in the charts when a neighbour asks whether your system is reaching their water, which is a screening comparison you make by eye in the reports and not an automatic one. Two things this cannot do: nitrate and E. coli are not in this sensor set, and they are exactly what a health authority samples for.
Alarm example: Turbidity on the sand-filter discharge crosses the value your practitioner sets, and the alert goes out by automated phone call, SMS, email and push to the campground manager and the maintenance contractor.
Which rules apply turns on your province and your system design flow, the maintenance plan stays with your authorized person or registered practitioner, and the result a health authority acts on is an accredited laboratory sample and not a probe reading.
- Ontario Ministry of the Environment, Design Guidelines for Sewage Works, chapter 19 co-treatment of septage, Table 19-1, 2008
- Government of British Columbia, Municipal Wastewater Regulation (B.C. Reg. 87/2012), monitoring for discharges to ground, ss. 86 and 87, 2012
- Government of British Columbia, Sewerage System Regulation (B.C. Reg. 326/2004), Type 1, Type 2 and Type 3 treatment and the authorized person, 2004
- Government of Ontario, Building Code (O. Reg. 332/12), Division B Part 8 sewage systems, 2012
Irrigation, dugouts and greenhouse fertigation
Licensed irrigators and agrologists, ranchers watering from dugouts, and greenhouse growers running recirculated nutrient solution.
8 parametersVolume meter
Irrigation, dugouts and greenhouse fertigation
Licensed irrigators and agrologists, ranchers watering from dugouts, and greenhouse growers running recirculated nutrient solution.
8 parametersVolume meter
The problem
Source salinity is not constant, and a laboratory result arrives days after the water is already on the field; FAO puts irrigation water above ECw 0.7 dS/m into the slight-to-moderate restriction band (Ayers and Westcot, FAO Irrigation and Drainage Paper 29 Rev. 1, Table 1, 1985). In a dugout, Alberta notes cyanobacteria can grow at water temperatures below 20 degrees C, suggests you start watching from that temperature because growth accelerates as it warms, and says that where a bloom is suspected you keep livestock off the water and have the growth identified by a water specialist (Government of Alberta, Agri-News, 2026), which on a quarter section means a weekly drive at best. Drip blocks plug from solid particles in suspension, one of the physical contributors tabulated for localized irrigation (FAO Irrigation and Drainage Paper 29 Rev. 1, Table 24, 1985), and the first sign is usually a dry row. In a restriction year the question becomes how much you actually took, and pump hours times an assumed rate is not a volume.
What changes
One concentrator per intake, dugout or greenhouse reads conductivity, pH, suspended solids, turbidity and blue-green algae fluorescence continuously and logs every reading, so you watch a trend form instead of meeting it at the threshold. An ultrasonic meter from DN25 (1 in.) to DN150 (6 in.) turns pump hours into a dated per-day volume with CSV and Excel export, which matters where a fish population protection order under section 88 of the Water Sustainability Act has suspended specified licensees’ rights, as orders have on B.C. streams including the Koksilah, Bessette and Salmon in years since 2019, and where that curtailment does not follow first-in-time-first-in-right (Government of British Columbia, 2026). On recirculated nutrient solution a potassium ion measurement earns its place, because conductivity tells you how much salt is present and never which salt. State the ceiling honestly: fluorescence indicates pigment and biomass rather than toxin, and sodium adsorption ratio, chloride, boron, nitrate and sulphate are not in this sensor set.
Alarm example: Conductivity at the irrigation intake crosses the ECw value your agrologist sets for the crop in that block, and the alert goes out by SMS, automated phone call, push and email to the farm manager and the agrologist.
The FAO salinity and clogging bands are guidance rather than permit limits, livestock water quality in Canada is provincial guidance written around accredited laboratory mineral analysis, and what you must meter and report comes from your own licence, permit or district agreement.
- Ayers and Westcot, Water Quality for Agriculture, FAO Irrigation and Drainage Paper 29 Rev. 1, Tables 1 and 24, 1985
- Government of Alberta, Agri-News: Blue-green algae in dugouts, what to watch for when the heat rises, 2026
- Government of British Columbia, Water Sustainability Act temporary protection orders, 2026
Pools, spas and splash pads
Aquatic supervisors and building operators at municipalities, hotels, schools and stratas.
4 parametersVolume meter
Pools, spas and splash pads
Aquatic supervisors and building operators at municipalities, hotels, schools and stratas.
4 parametersVolume meter
The problem
Your operators test while the facility is open. In Ontario the recorded checks of free available chlorine, pH, alkalinity and clarity run 30 minutes before opening and then every two hours, or every four hours where an automatic sensing device is installed (Ontario Ministry of Health, Recreational Water Reference Document, 2025); in British Columbia pH, disinfectant and combined chlorine are tested at least twice daily (Pool Regulation, B.C. Reg. 296/2010). Between the last test on Friday evening and the first on Saturday morning there is no record at all, and that is when a feed pump stalls, a controller probe fouls, or a splash pad on a timer runs on bad water. You find out at opening, with a lineup at the door and nothing to show the inspector about the gap.
What changes
A flow cell fed from the recirculation line logs residual chlorine and pH/ORP continuously, through the night and across the long weekend. The charts show the overnight shape: how far the residual sagged, how long it stayed down, when it came back. Where an automatic sensing device is installed, Ontario sets ORP between 600 and 900 mV (Ontario Ministry of Health, Recreational Water Reference Document, 2025), and a continuous ORP trace sitting beside your recorded manual tests is context you can show a public health inspector, not a substitute for the recorded test. Conductivity tracks dissolved-solids build-up between drains, and turbidity turns water clarity into a logged number instead of a judgement call.
Alarm example: Residual chlorine at the recirculation flow cell dropping below the floor you set places an automated phone call to the on-call aquatic lead and sends an SMS and email to the facility supervisor.
The regulated measurement stays your operator’s recorded test under your own province’s pool regulation, and this monitor is not the automatic sensing device those rules describe, because it does not control your chemical feeders.
- Ontario Ministry of Health, Recreational Water Reference Document (requirements of Reg. 565, Public Pools), 2025
- Province of British Columbia, Pool Regulation, B.C. Reg. 296/2010 under the Public Health Act, 2010
Beaches and lakes through bloom season
Beach program staff, lake and cottage associations, conservation authorities and guardian monitoring teams.
5 parameters
Beaches and lakes through bloom season
Beach program staff, lake and cottage associations, conservation authorities and guardian monitoring teams.
5 parameters
The problem
Bloom season does not wait for your sampling round. Across Canada most cyanobacteria monitoring during bathing season is reactive, with proactive monitoring limited to priority beaches, and the only health-based indicators in use are cyanotoxins, which few programs can test often (O’Keeffe, Environmental Health Review, 2024). Confirmed cyanobacterial bloom reports in Ontario have kept rising through the 21st century (Favot et al., Lake and Reservoir Management, 2023). A scum can form, drift along the shore and collapse between two weekly visits, leaving you to describe it from a photograph somebody texted you.
What changes
One station with a flow cell fed from a shoreline sample line logs chlorophyll / blue-green algae fluorescence, turbidity and dissolved oxygen right through the season, so you watch the pigment building instead of arriving to find it. That is what a screening indicator is for: Health Canada treats chlorophyll-a as usable within a cyanobacteria alert system while noting it is not specific to cyanobacteria, and publishes federal guideline values of 10 µg/L total microcystins, 50 000 cells/mL total cyanobacterial cells and 4.5 mm³/L total cyanobacterial biovolume (Health Canada, Guidelines for Canadian Recreational Water Quality: Cyanobacteria and Their Toxins, 2022); the numbers your program acts on are the ones your own province, territory or health authority has adopted. The trace tells you which day to send somebody out for the accredited sample, and a continuous dissolved oxygen record captures the overnight sag a daytime grab sample never sees. Reports and charts put an upstream and a downstream station on one time axis so you can read them against each other.
Alarm example: Chlorophyll / blue-green algae fluorescence at the beach station crossing the screening level you set sends an SMS and email to the beach program lead and to the steward carrying the weekend phone.
Fluorescence measures pigment and never toxin, E. coli cannot be measured by any probe here, and the decision to post or lift a swimming advisory rests with your health authority on accredited laboratory results.
- O’Keeffe, Managing cyanobacterial blooms in recreational waters: decision support tools for public health responses, 2024
- Health Canada, Guidelines for Canadian Recreational Water Quality: Cyanobacteria and Their Toxins, 2022
- Favot et al., Cyanobacterial blooms in Ontario, Canada: continued increase in reports through the 21st century, 2023
Sewer discharge points and oil separators
Fleet and yard supervisors, plant environmental leads and pretreatment operators.
6 parametersVolume meter
Sewer discharge points and oil separators
Fleet and yard supervisors, plant environmental leads and pretreatment operators.
6 parametersVolume meter
The problem
A separator gives no sign that it has stopped working. Toronto requires an oil interceptor at every premises where motor vehicles are repaired, lubricated or maintained and connected to a sewer, and sets sanitary sewer limits of pH between 6.0 and 11.5, mineral or synthetic oil and grease at 15 mg/L, animal or vegetable oil and grease at 150 mg/L, and suspended solids at 350 mg/L (City of Toronto Municipal Code Chapter 681, 2023). Metro Vancouver prohibits discharge below pH 5.5 or above pH 10.5 and caps hydrocarbon oil and grease at 15 mg/L, total oil and grease at 150 mg/L, suspended solids at 600 mg/L and five-day biochemical oxygen demand (BOD5) at 500 mg/L (GVS&DD Sewer Use Bylaw No. 299, 2007, consolidated to 2023). On the food and beverage side the swing is organic rather than oily: Metro Vancouver’s fermentation rules ask for one recorded pH reading on days equipment is cleaned and sterilized, with records held two years (Fermentation Operations Bylaw No. 294, 2015), and one reading a day says nothing about the caustic rinse at 22:00.
What changes
A flow cell on the line leaving your pretreatment or equalization tank carries pH/ORP, oil in water, suspended solids and COD together, so a slug shows up as a shape on a chart the same evening rather than in a letter weeks later. COD is quick enough to be useful as an organic-load surrogate, but it stays a surrogate: the correlation to the BOD5 your bylaw actually names has to be established for your own effluent. Reports put the parameters on one time axis, which is how you learn that a peak belongs to one wash bay, one shift or one tank clean-out rather than to the whole plant. Where the point of interest is a wet well at a fuel depot, siting the panel and the sample tap is a classified-location question to settle site by site with your electrical authority.
Alarm example: Oil in water at the separator outlet crossing the level you set places an automated phone call to the yard supervisor and sends an email to the environmental coordinator.
Your limits come from your own municipality’s sewer-use bylaw, and they are enforced on accredited laboratory analysis of a grab sample using a solvent-extractable method for oil and grease, so treat the online oil-in-water reading as an indicator and a trend rather than as that laboratory result.
- Greater Vancouver Sewerage and Drainage District, Sewer Use Bylaw No. 299, 2007 (unofficial consolidation as of 28 July 2023), 2023
- City of Toronto, Municipal Code Chapter 681, Sewers, 2023
- Metro Vancouver, Fermentation Operations Bylaw Guide (GVS&DD Fermentation Operations Bylaw No. 294, 2015), 2020
Four things this system does not do. If one of them matters at your site, better that you read it here than find it out after the probe is in the wall.
Online sensors indicate and trend
The number an authority normally enforces on is an accredited laboratory result from a collected sample. This equipment is not an accredited or approved compliance instrument and it is not a regulatory analyzer. What continuous measurement does is different work: it shows you the shape of an event, tells you which hour to attend and which tap or which well to sample, and leaves a dated record of the hours nobody was on site. Treat it as the thing that tells you when to sample, not as the thing that replaces the sample.
Your limits come from your permit or bylaw
Thresholds and monitoring intervals are jurisdictional. They come from your own approval, your discharge permit, your municipal sewer-use or erosion and sediment control bylaw, or the protocol your operating authority works under. We do not set them, we do not publish a number and call it national, and we will not tell you that a given value clears you. Read the regulation that applies to your site, and set your alarm to the number written in it.
An inline meter needs a full closed pipe
The ultrasonic meters measure volume in a pressurized pipe that runs full, DN25 (1 in.) to DN150 (6 in.), with straight pipe upstream and downstream. Open channels are out of scope: a weir, a pond outfall, a gravity sanitary sewer, lay-flat hose, an open standpipe. Mains larger than DN150 (6 in.) are out of range. It is also not a legal-for-trade or custody-transfer instrument, so any metrological condition written into your permit stands on its own.
Probes drift and foul, and servicing is real recurring work
Calibration against standards and cleaning the probe face and flow cell are part of owning this, not an optional extra. Optical probes foul in solids-laden water. Dissolved oxygen and ORP are the most drift-prone measurements and are best read as trends. Ion-selective probes need checking against standards. A neglected probe does not go blank, which is the dangerous part: it produces confident wrong numbers. Plan the routine, keep the log, and decide who does it before the first probe goes in.
Configure your monitoring point
Tick the parameters you need, add a meter size if you measure volume, and tell us where the water is. One MaxLinc Data Concentrator covers one measurement point and reads every sensor you tick.
Tell us about your measurement point
Describe the water, the point and the person who carries the after-hours phone, and we will come back with the sensor list, the meter size and what the installation actually needs. One concentrator per site, cellular worldwide or site WiFi, continuous logging, and alarms that reach a person by push notification, email, SMS and automated phone call.